. 2010 Apr 30;285(18):13742-7.
doi: 10.1074/jbc.M109.098400. Epub 2010 Mar 10.

Mitochondrial and nuclear genomic responses to loss of LRPPRC expression

Affiliations

Mitochondrial and nuclear genomic responses to loss of LRPPRC expression

Vishal M Gohil et al. J Biol Chem. .

Erratum in

Abstract

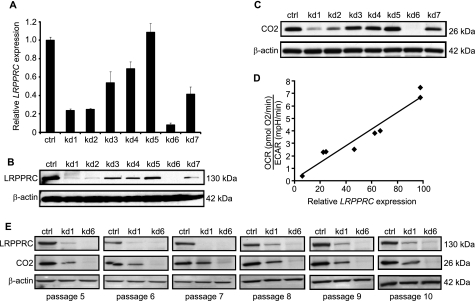
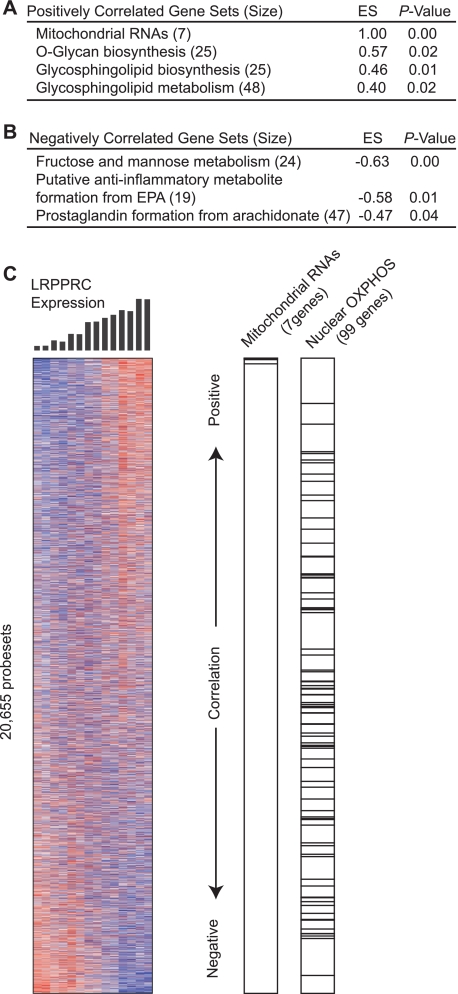
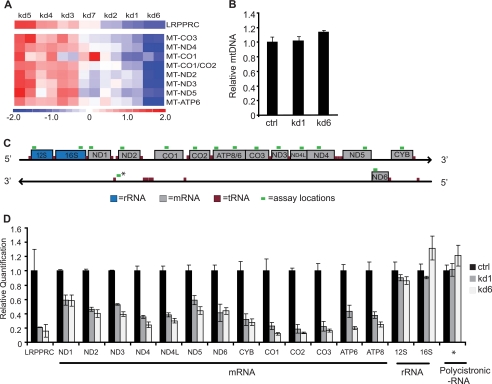
Rapid advances in genotyping and sequencing technology have dramatically accelerated the discovery of genes underlying human disease. Elucidating the function of such genes and understanding their role in pathogenesis, however, remain challenging. Here, we introduce a genomic strategy to characterize such genes functionally, and we apply it to LRPPRC, a poorly studied gene that is mutated in Leigh syndrome, French-Canadian type (LSFC). We utilize RNA interference to engineer an allelic series of cellular models in which LRPPRC has been stably silenced to different levels of knockdown efficiency. We then combine genome-wide expression profiling with gene set enrichment analysis to identify cellular responses that correlate with the loss of LRPPRC. Using this strategy, we discovered a specific role for LRPPRC in the expression of all mitochondrial DNA-encoded mRNAs, but not the rRNAs, providing mechanistic insights into the enzymatic defects observed in the disease. Our analysis shows that nuclear genes encoding mitochondrial proteins are not collectively affected by the loss of LRPPRC. We do observe altered expression of genes related to hexose metabolism, prostaglandin synthesis, and glycosphingolipid biology that may either play an adaptive role in cell survival or contribute to pathogenesis. The combination of genetic perturbation, genomic profiling, and pathway analysis represents a generic strategy for understanding disease pathogenesis.


Figures

FIGURE 1.
FIGURE 1.
Using RNAi to engineer cellular models of LSFC. A, LRPPRC mRNA quantified by qRT-PCR on RNA extracted from MCH58 human fibroblasts infected with an empty vector, pLKO.1 (ctrl), or one of seven independent shRNAs targeting LRPPRC. Values are reported as fold change in expression over control (ctrl). Three biological replicates were used per hairpin (error bars represent S.D.). β-Actin expression was used as an endogenous control. B, Western blot detection of LRPPRC protein abundance in LRPPRC knockdown cell lines. C, Western blot detection of CO2 protein abundance in LRPPRC knockdown cell lines. D, correlation between the ratio of OCR to ECAR and LRPPRC expression as measured in A (n ≥ 4). E, Western blots of LRPPRC and CO2 protein abundance over the course of five passages spanning ∼15–30 days of culture after infection with pLKO.1 or one of the two most potent hairpins.
FIGURE 2.
FIGURE 2.
Gene set enrichment analysis of genomic profiles following LRPPRC knockdown. A, list of gene sets that are positively correlated with LRPPRC expression. B, list of gene sets that are negatively correlated with LRPPRC expression. Only gene sets that show p < 0.050 and false discovery rate <0.250 are listed. C, left, heat map showing expression of all 20,655 genes. Genes were ordered by their correlation to the LRPPRC expression profile (shown in black bars), with genes showing the strongest correlation at the top and the genes showing the strongest anticorrelation at the bottom. Red color indicates the highest expression, and blue color indicates the lowest. Right, bar plot indicating genes belonging to mitochondrial RNAs and nuclear OXPHOS genes.
FIGURE 3.
FIGURE 3.
LRPPRC is required for the maintenance of mitochondrial mRNAs. A, heat map showing abundance of mitochondrial transcripts in LSFC cell lines as identified by microarray. Two replicates of each knockdown are shown adjacent to each other. B, mtDNA copy number as quantified by qRT-PCR for two most potent knockdowns and the pLKO.1-transduced control (ctrl) cell line. Values are reported as fold change over cells infected with pLKO.1 (n = 3; error bars represent S.D. from mean). C, schematic representation of qRT-PCR Taqman assay locations for mitochondrial transcripts. rRNA are indicated by blue, mRNA by gray, tRNA by red, and assay location by green. * denotes location of assay for polycistronic transcript. D, mitochondrial mRNA, rRNA, and polycistronic RNA transcript were quantified for each of the two most potent knockdowns by qRT-PCR. Values are reported as fold change over control cells; β-actin was used as endogenous control (n = 3; error bars represent S.D.).

Similar articles

Cited by

References

    1. McCarthy M. I., Abecasis G. R., Cardon L. R., Goldstein D. B., Little J., Ioannidis J. P., Hirschhorn J. N. (2008) Nat. Rev. Genet. 9, 356–369 - PubMed
    1. Giallourakis C., Henson C., Reich M., Xie X., Mootha V. K. (2005) Annu. Rev. Genomics Hum. Genet. 6, 381–406 - PubMed
    1. Ng S. B., Buckingham K. J., Lee C., Bigham A. W., Tabor H. K., Dent K. M., Huff C. D., Shannon P. T., Jabs E. W., Nickerson D. A., Shendure J., Bamshad M. J. (2010) Nat. Genet. 42, 30–35 - PMC - PubMed
    1. Lee N., Daly M. J., Delmonte T., Lander E. S., Xu F., Hudson T. J., Mitchell G. A., Morin C. C., Robinson B. H., Rioux J. D. (2001) Am. J. Hum. Genet. 68, 397–409 - PMC - PubMed
    1. Mootha V. K., Lepage P., Miller K., Bunkenborg J., Reich M., Hjerrild M., Delmonte T., Villeneuve A., Sladek R., Xu F., Mitchell G. A., Morin C., Mann M., Hudson T. J., Robinson B., Rioux J. D., Lander E. S. (2003) Proc. Natl. Acad. Sci. U.S.A. 100, 605–610 - PMC - PubMed

Publication types

MeSH terms

Associated data