

A lipid pathway for ligand binding is necessary for a cannabinoid G protein-coupled receptor
- PMID: 20220143
- PMCID: PMC2878557
- DOI: 10.1074/jbc.M109.041590
A lipid pathway for ligand binding is necessary for a cannabinoid G protein-coupled receptor
Abstract
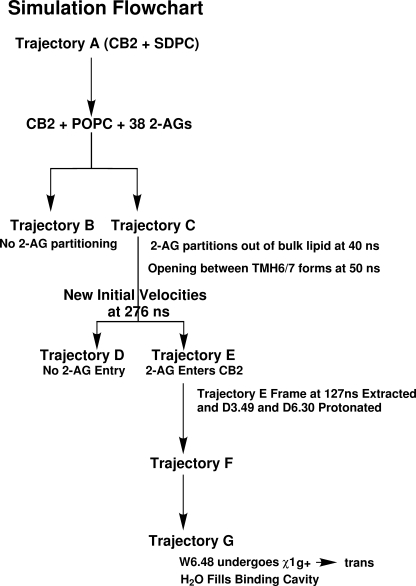
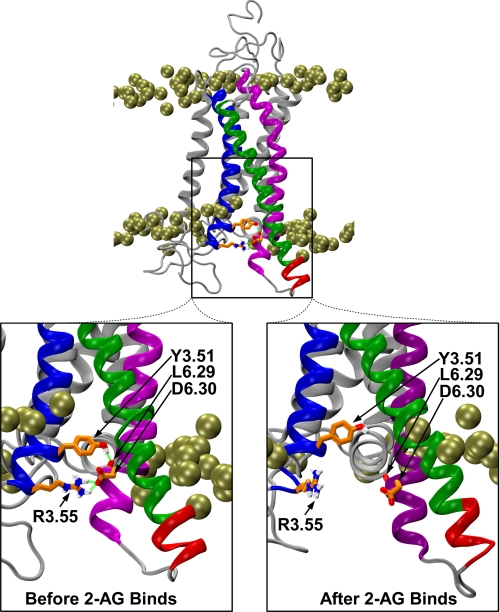
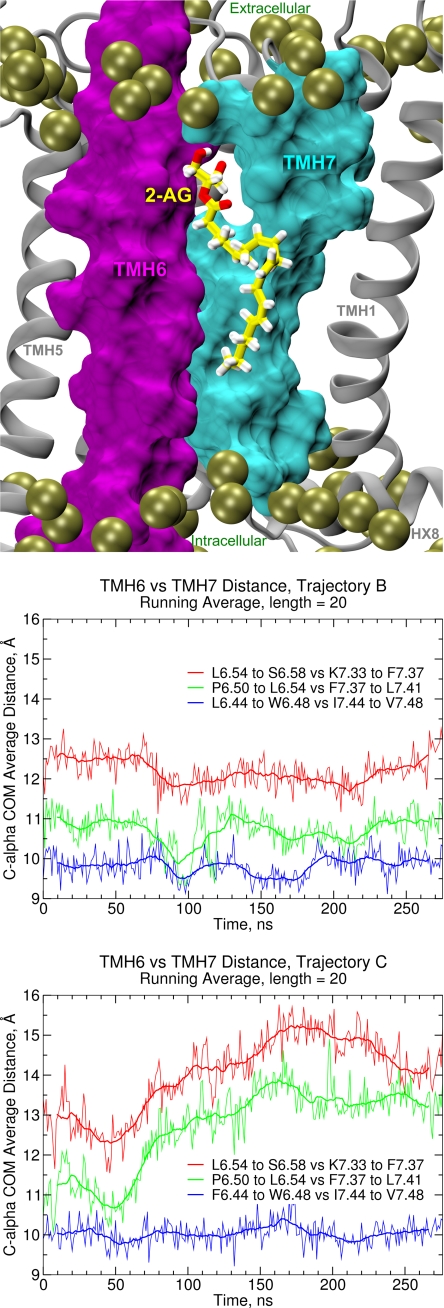
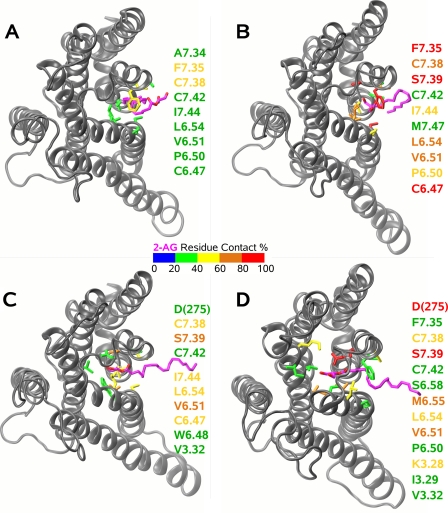
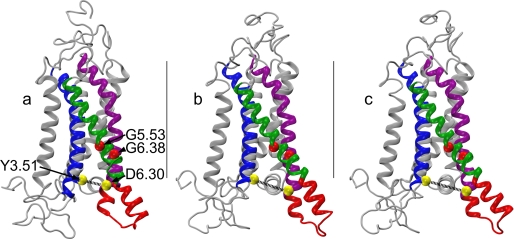
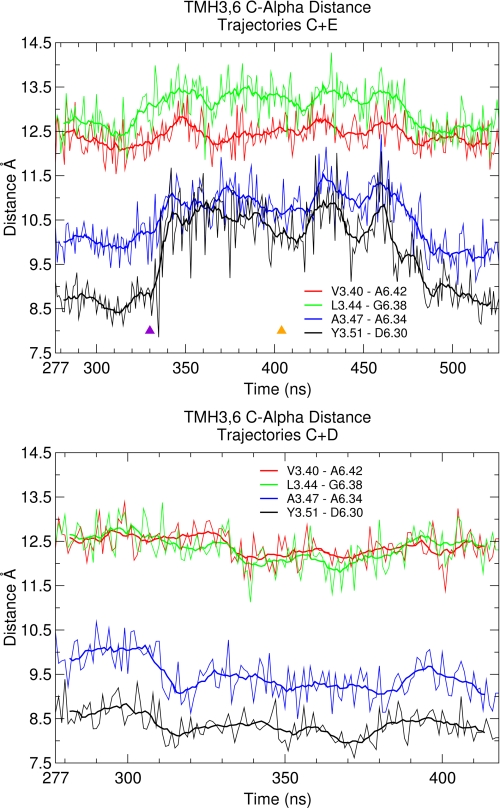
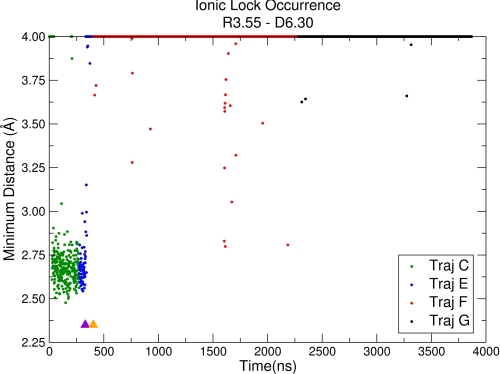
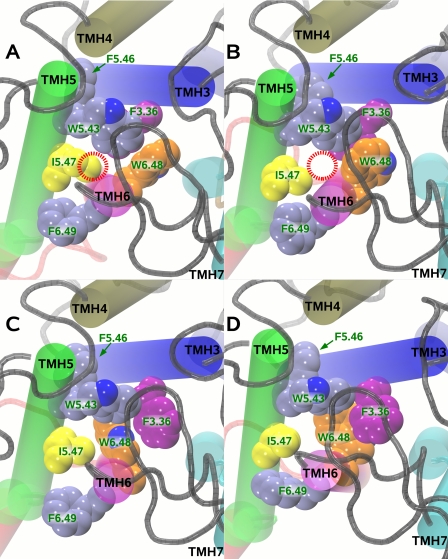
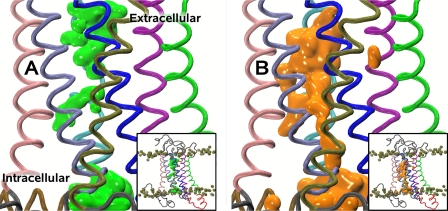
Recent isothiocyanate covalent labeling studies have suggested that a classical cannabinoid, (-)-7'-isothiocyanato-11-hydroxy-1',1'dimethylheptyl-hexahydrocannabinol (AM841), enters the cannabinoid CB2 receptor via the lipid bilayer (Pei, Y., Mercier, R. W., Anday, J. K., Thakur, G. A., Zvonok, A. M., Hurst, D., Reggio, P. H., Janero, D. R., and Makriyannis, A. (2008) Chem. Biol. 15, 1207-1219). However, the sequence of steps involved in such a lipid pathway entry has not yet been elucidated. Here, we test the hypothesis that the endogenous cannabinoid sn-2-arachidonoylglycerol (2-AG) attains access to the CB2 receptor via the lipid bilayer. To this end, we have employed microsecond time scale all-atom molecular dynamics (MD) simulations of the interaction of 2-AG with CB2 via a palmitoyl-oleoyl-phosphatidylcholine lipid bilayer. Results suggest the following: 1) 2-AG first partitions out of bulk lipid at the transmembrane alpha-helix (TMH) 6/7 interface; 2) 2-AG then enters the CB2 receptor binding pocket by passing between TMH6 and TMH7; 3) the entrance of the 2-AG headgroup into the CB2 binding pocket is sufficient to trigger breaking of the intracellular TMH3/6 ionic lock and the movement of the TMH6 intracellular end away from TMH3; and 4) subsequent to protonation at D3.49/D6.30, further 2-AG entry into the ligand binding pocket results in both a W6.48 toggle switch change and a large influx of water. To our knowledge, this is the first demonstration via unbiased molecular dynamics that a ligand can access the binding pocket of a class A G protein-coupled receptor via the lipid bilayer and the first demonstration via molecular dynamics of G protein-coupled receptor activation triggered by a ligand binding event.
Figures

Similar articles
-
Lipid bilayer molecular dynamics study of lipid-derived agonists of the putative cannabinoid receptor, GPR55.Chem Phys Lipids. 2011 Feb;164(2):131-43. doi: 10.1016/j.chemphyslip.2010.12.003. Epub 2010 Dec 24. Chem Phys Lipids. 2011. PMID: 21185816 Free PMC article.
-
Human Cannabinoid Receptor 2 Ligand-Interaction Motif: Transmembrane Helix 2 Cysteine, C2.59(89), as Determinant of Classical Cannabinoid Agonist Activity and Binding Pose.ACS Chem Neurosci. 2017 Jun 21;8(6):1338-1347. doi: 10.1021/acschemneuro.7b00003. Epub 2017 Mar 1. ACS Chem Neurosci. 2017. PMID: 28220706
-
Cannabinoid CB1 receptor recognition of endocannabinoids via the lipid bilayer: molecular dynamics simulations of CB1 transmembrane helix 6 and anandamide in a phospholipid bilayer.J Comput Aided Mol Des. 2006 Jul-Aug;20(7-8):495-509. doi: 10.1007/s10822-006-9068-9. Epub 2006 Nov 14. J Comput Aided Mol Des. 2006. PMID: 17106765
-
Endocannabinoid binding to the cannabinoid receptors: what is known and what remains unknown.Curr Med Chem. 2010;17(14):1468-86. doi: 10.2174/092986710790980005. Curr Med Chem. 2010. PMID: 20166921 Free PMC article. Review.
-
2-Arachidonoylglycerol and the cannabinoid receptors.Chem Phys Lipids. 2000 Nov;108(1-2):89-106. doi: 10.1016/s0009-3084(00)00189-4. Chem Phys Lipids. 2000. PMID: 11106784 Review.
Cited by
-
A Closer Look at Anandamide Interaction With TRPV1.Front Mol Biosci. 2020 Jul 21;7:144. doi: 10.3389/fmolb.2020.00144. eCollection 2020. Front Mol Biosci. 2020. PMID: 32793630 Free PMC article.
-
Difference and Influence of Inactive and Active States of Cannabinoid Receptor Subtype CB2: From Conformation to Drug Discovery.J Chem Inf Model. 2016 Jun 27;56(6):1152-63. doi: 10.1021/acs.jcim.5b00739. Epub 2016 May 26. J Chem Inf Model. 2016. PMID: 27186994 Free PMC article.
-
Elastic Network Models are Robust to Variations in Formalism.J Chem Theory Comput. 2012 Jul 10;8(7):2424-2434. doi: 10.1021/ct3000316. Epub 2012 Jun 5. J Chem Theory Comput. 2012. PMID: 22924033 Free PMC article.
-
Agonist dynamics and conformational selection during microsecond simulations of the A(2A) adenosine receptor.Biophys J. 2012 May 2;102(9):2114-20. doi: 10.1016/j.bpj.2012.03.061. Biophys J. 2012. PMID: 22824275 Free PMC article.
-
Beyond standard molecular dynamics: investigating the molecular mechanisms of G protein-coupled receptors with enhanced molecular dynamics methods.Adv Exp Med Biol. 2014;796:95-125. doi: 10.1007/978-94-007-7423-0_6. Adv Exp Med Biol. 2014. PMID: 24158803 Free PMC article. Review.
References
-
- Munro S., Thomas K. L., Abu-Shaar M. (1993) Nature 365, 61–65 - PubMed
-
- Galiègue S., Mary S., Marchand J., Dussossoy D., Carrière D., Carayon P., Bouaboula M., Shire D., Le Fur G., Casellas P. (1995) Eur. J. Biochem. 232, 54–61 - PubMed
-
- Howlett A. C., Barth F., Bonner T. I., Cabral G., Casellas P., Devane W. A., Felder C. C., Herkenham M., Mackie K., Martin B. R., Mechoulam R., Pertwee R. G. (2002) Pharmacol. Rev. 54, 161–202 - PubMed
Publication types
MeSH terms
Substances
Grants and funding
LinkOut - more resources
Full Text Sources
Other Literature Sources
