. 2010 Mar 5;6(3):e1000866.
doi: 10.1371/journal.pgen.1000866.

Rapid assessment of genetic ancestry in populations of unknown origin by genome-wide genotyping of pooled samples

Affiliations

Rapid assessment of genetic ancestry in populations of unknown origin by genome-wide genotyping of pooled samples

Charleston W K Chiang et al. PLoS Genet. .

Abstract

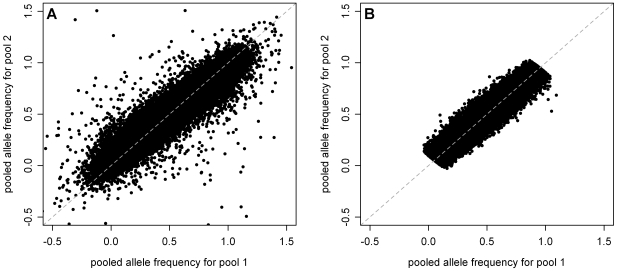
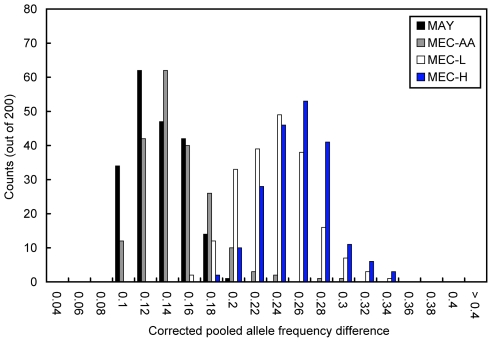
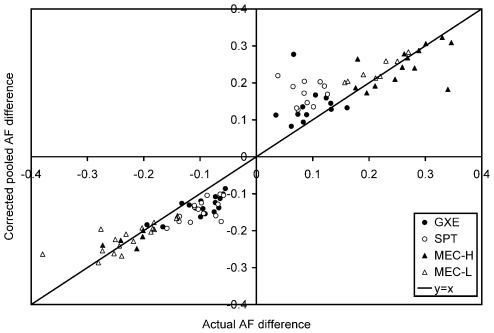
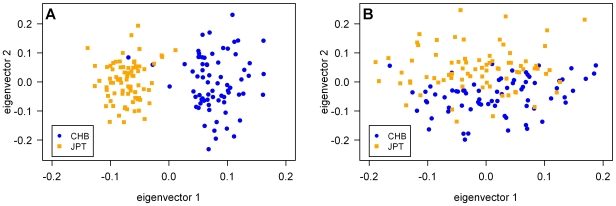
As we move forward from the current generation of genome-wide association (GWA) studies, additional cohorts of different ancestries will be studied to increase power, fine map association signals, and generalize association results to additional populations. Knowledge of genetic ancestry as well as population substructure will become increasingly important for GWA studies in populations of unknown ancestry. Here we propose genotyping pooled DNA samples using genome-wide SNP arrays as a viable option to efficiently and inexpensively estimate admixture proportion and identify ancestry informative markers (AIMs) in populations of unknown origin. We constructed DNA pools from African American, Native Hawaiian, Latina, and Jamaican samples and genotyped them using the Affymetrix 6.0 array. Aided by individual genotype data from the African American cohort, we established quality control filters to remove poorly performing SNPs and estimated allele frequencies for the remaining SNPs in each panel. We then applied a regression-based method to estimate the proportion of admixture in each cohort using the allele frequencies estimated from pooling and populations from the International HapMap Consortium as reference panels, and identified AIMs unique to each population. In this study, we demonstrated that genotyping pooled DNA samples yields estimates of admixture proportion that are both consistent with our knowledge of population history and similar to those obtained by genotyping known AIMs. Furthermore, through validation by individual genotyping, we demonstrated that pooling is quite effective for identifying SNPs with large allele frequency differences (i.e., AIMs) and that these AIMs are able to differentiate two closely related populations (HapMap JPT and CHB).


Conflict of interest statement

The authors have declared that no competing interests exist.

Figures

Figure 1
Figure 1. Estimated allele frequencies in MEC-H pool 1 versus MEC-H pool 2 before and after application of QC filters.
Estimated allele frequencies for 100,000 random SNPs from the two MEC-H pools were plotted against each other (A) before SNP QC filtering and (B) after applying all four SNP QC filters. There were ∼869 K autosomal SNPs pre-QC filtering, and ∼306 K SNPs post-QC filtering (see Methods). Among the 5,000 SNPs with the largest AF differences between the two pools, the mean AF difference in the post-QC filtered dataset was significantly reduced (0.604 pre-QC versus 0.186 post-QC, P≪10−15 by unpaired two-tailed t-test). Note that this comparison is based only on the average of allele frequency estimates, without taking into account the error involved in such estimates, which is compensated for when calculating the association χ2 statistic (see Methods).
Figure 2
Figure 2. Distribution of allele frequency differences among the top 200 AIMs.
The distribution of the corrected allele frequency differences between the estimated pooled allele frequency and that expected based on each population's respective pseudopopulation among the top 200 putative AIMs is shown for the MEC-AA, MEC-H, and MEC-L pools. Corrected pooled AF difference was calculated by fixing the AF in the pseudopopulation, computing the pooled AF in the appropriate direction given the deflated χ2 statistic, and then taking the difference. The distribution observed in the MAY pool represents the null distribution in which few additional validated AIMs are expected. To provide an estimate of the expected AF difference in a scenario where only sampling variation is responsible for the allele frequency difference between a population and its pseudopopulation, we simulated genotypes at ∼382 K SNPs for 521 individuals (the same number of post-QC SNPs and individuals as used in the MAY pools), drawing from the allele frequency in YRI 82% of the time and CEU 18% of the time, and compared the allele frequency of the simulated genotypes to that expected based on a 82%–18% mix of YRI and CEU. From this comparison, the top “AIMs” would only have an allele frequency difference of < ∼0.08.
Figure 3
Figure 3. Validation by individual genotyping of the top putative AIMs in the individuals that comprised the pools.
The actual AF difference between the population AF and that of the pseudopopulation was plotted against the corrected AF difference predicted by pooling for 25, 28, 26, and 19 of the top candidate AIMs in MEC-L, GXE, SPT, and MEC-H, respectively. Corrected pooled AF difference was calculated as in Figure 2. Filled circles represent results from GXE, unfilled circles are those from SPT, filled triangles are those from MEC-H, and unfilled triangles are those from MEC-L. In all three populations the classification of a putative AIM as either “encouraging” or “inconclusive” (see Methods) did not appear to correlate with the probability of successful validation (data not shown).
Figure 4
Figure 4. The top two axes of variation from principal component analysis of JPT and CHB.
Results from EIGENSTRAT were based on (A) 420 putative AIMs selected by comparing the MEC-J pools to the CHD population from HapMap phase 3 and (B) 420 random SNPs. Differentiation between JPT and CHB is clear when using the set of putative AIMs, compared to that using the same number of random SNPs. Note that the two CHB individuals within the JPT cluster in (A) would also cluster with JPT individuals if genome-wide data were used (data not shown). Similar differentiation using random SNPs could also be achieved when ∼3,100 random SNPs were used (data not shown).

References

    1. Li JZ, Absher DM, Tang H, Southwick AM, Casto AM, et al. Worldwide human relationships inferred from genome-wide patterns of variation. Science. 2008;319:1100–1104. - PubMed
    1. Rosenberg NA, Pritchard JK, Weber JL, Cann HM, Kidd KK, et al. Genetic structure of human populations. Science. 2002;298:2381–2385. - PubMed
    1. Smith MW, O'Brien SJ. Mapping by admixture linkage disequilibrium: advances, limitations and guidelines. Nat Rev Genet. 2005;6:623–632. - PubMed
    1. Price AL, Patterson NJ, Plenge RM, Weinblatt ME, Shadick NA, et al. Principal components analysis corrects for stratification in genome-wide association studies. Nat Genet. 2006;38:904–909. - PubMed
    1. Devlin B, Roeder K. Genomic control for association studies. Biometrics. 1999;55:997–1004. - PubMed

Publication types

Substances