. 2010 Mar 5;6(3):e1000694.
doi: 10.1371/journal.pcbi.1000694.

Diffusion, crowding & protein stability in a dynamic molecular model of the bacterial cytoplasm

Affiliations

Diffusion, crowding & protein stability in a dynamic molecular model of the bacterial cytoplasm

Sean R McGuffee et al. PLoS Comput Biol. .

Abstract

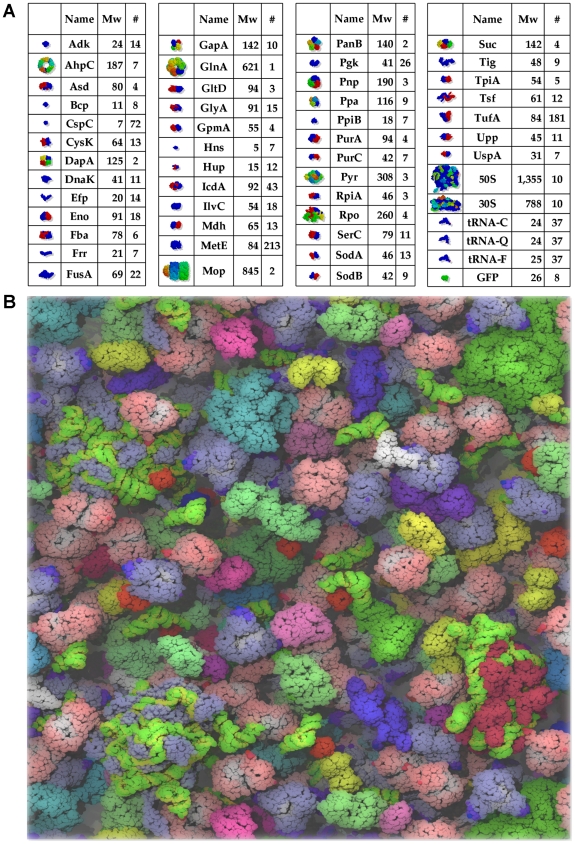
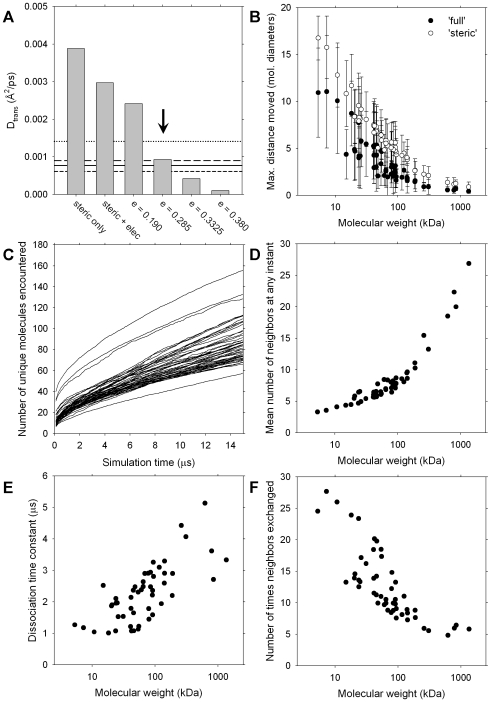
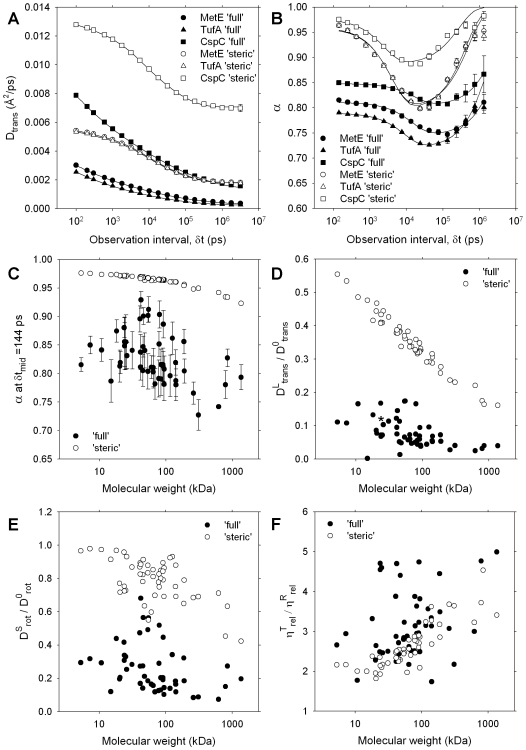
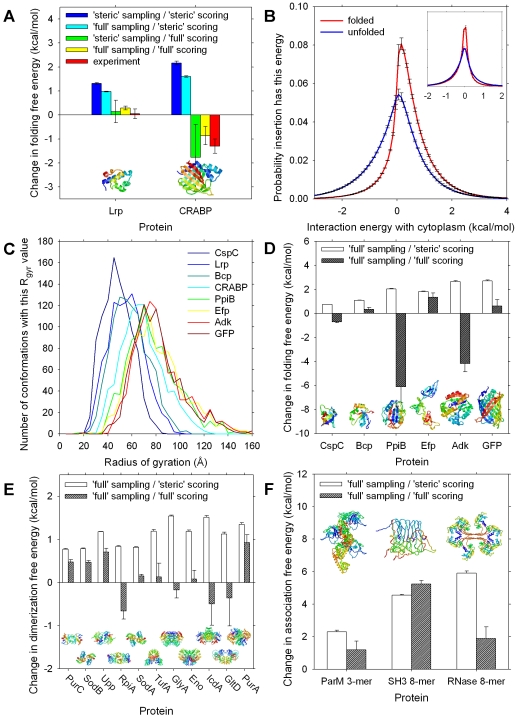
A longstanding question in molecular biology is the extent to which the behavior of macromolecules observed in vitro accurately reflects their behavior in vivo. A number of sophisticated experimental techniques now allow the behavior of individual types of macromolecule to be studied directly in vivo; none, however, allow a wide range of molecule types to be observed simultaneously. In order to tackle this issue we have adopted a computational perspective, and, having selected the model prokaryote Escherichia coli as a test system, have assembled an atomically detailed model of its cytoplasmic environment that includes 50 of the most abundant types of macromolecules at experimentally measured concentrations. Brownian dynamics (BD) simulations of the cytoplasm model have been calibrated to reproduce the translational diffusion coefficients of Green Fluorescent Protein (GFP) observed in vivo, and "snapshots" of the simulation trajectories have been used to compute the cytoplasm's effects on the thermodynamics of protein folding, association and aggregation events. The simulation model successfully describes the relative thermodynamic stabilities of proteins measured in E. coli, and shows that effects additional to the commonly cited "crowding" effect must be included in attempts to understand macromolecular behavior in vivo.


Conflict of interest statement

The authors have declared that no competing interests exist.

Figures

Figure 1
Figure 1. The cytoplasm model.
A. Schematic inventory of the contents of the cytoplasm model. B. Rendering of the cytoplasm model at the end of a Brownian dynamics simulation performed with the ‘full’ energy model (see text). RNA is shown as green and yellow. This figure was prepared with VMD .
Figure 2
Figure 2. Parameterization and sampling in the cytoplasm model.
A. Extrapolated long-time Dtrans values for GFP from BD simulations performed with different energy models; ‘ε’ refers to the well-depth (in kcal/mol) of the Lennard-Jones potential used to describe hydrophobic interactions (see Methods). Solid, long-dash, short-dash and dotted lines are the experimental Dtrans values from refs. 14, 15, 16 and 17 respectively. The vertical arrow indicates the energy model selected for further BD simulation. B. Average of the maximum distance moved during the 15µs of production for all molecule types plotted versus their molecular weights. Upper error bars indicate the largest value of the maximum distance moved found for any molecule of that type; lower error bars indicate the smallest value of the maximum distance moved. All distances expressed in terms of the molecular diameters (obtained by doubling the hydrodynamic radius calculated by HydroPro . C. Average number of unique neighbors encountered by each molecule type as a function of simulation time; each line refers to a different molecule type. D. Average number of neighbors possessed by each molecule type at any instant, plotted versus molecular weight. E. Time constant for the slower of the two exponentials describing the rate at which neighbors are lost, plotted for each molecule type versus molecular weight. F. Average number of times that each molecule type's immediate neighbors exchange during 15µs simulation plotted versus molecular weight of each molecule type.
Figure 3
Figure 3. Translational and rotational diffusion in the cytoplasm model.
A. Dtrans values for the three most abundant proteins plotted versus observation interval δt; error bars indicate the standard deviation of values obtained from three independent simulations; solid lines represent fits to the data obtained by integrating the analytical functions shown in the next panel. B. Computed anomality exponents, α, obtained by numerically differentiating the Dtrans values shown in A; solid lines represent fits to the data using an analytical function defined in Methods. C. Anomality exponent, α, computed at the shortest accessible time interval (δtmid = 144ps) plotted for all molecule types versus molecular weight; error bars represent standard deviations from the three independent BD simulations. D. Long-time Dtrans values expressed relative to infinite-dilution values plotted versus molecular weight of each molecule type; asterisk denotes GFP. E. Short-time Drot values expressed relative to infinite-dilution values plotted versus molecular weight of each molecule type. F. Ratio of the effective translational and effective rotational viscosities, plotted for all molecule types versus molecule weight.
Figure 4
Figure 4. Thermodynamic effects of the cytoplasm model on protein folding and association equilibria.
A. Computed stabilization of the folded state relative to the unfolded state for two experimentally-studied proteins; experimental data for Lrp (λ6-85) and CRABP taken from refs and respectively. ‘steric sampling’ indicates that insertions were performed on snapshots taken from a BD simulation performed with the ‘steric’ energy function; ‘steric scoring’ etc. indicates that the ‘steric’ energy function was used to calculate the cytoplasm-interaction energies, Eint, of the inserted proteins. B. Histogram of interaction energies, Eint, obtained for all non-clashing insertions of the folded and unfolded state conformations of CRABP with snapshots sampled from the ‘full’ model BD simulations; inset shows the same for λ6-85. C. Distribution of radius of gyration values for the 1000 unfolded conformations generated with the RCG software ; distributions are plotted in order of increasing molecular weight of the studied proteins. D. Same as A. but showing computed results for six other proteins, listed in order of increasing molecular weight. E. Computed stabilization of dimeric form relative to two separated monomers for eleven proteins, listed in order of increasing molecular weight. F. Computed stabilization of oligomeric form relative to separated monomers for three proteins.

Similar articles

Cited by

References

    1. Dix JA, Verkman AS. Crowding effects on diffusion in solutions and cells. Annu Rev Biophys. 2008;37:247–263. - PubMed
    1. Zhou HX, Rivas GN, Minton AP. Macromolecular crowding and confinement: Biochemical, biophysical, and potential physiological consequences. Annu Rev Biophys. 2008;37:375–397. - PMC - PubMed
    1. Zimmerman SB, Minton AP. Macromolecular crowding – biochemical, biophysical, and physiological consequences. Annu Rev Biophys Biomol Struct. 1993;22:27–65. - PubMed
    1. Ghaemmaghami S, Oas TG. Quantitative protein stability measurement in vivo. Nature Struct Biol. 2001;8:879–882. - PubMed
    1. Reckel S, Hänsel R, Löhr F, Dötsch V. In-cell NMR spectroscopy. Prog Nuc Mag Res Spec. 2007;51:91–101.

Publication types

Substances