. 2010 Mar 5;6(3):e1000702.
doi: 10.1371/journal.pcbi.1000702.

Mathematical modelling of cell-fate decision in response to death receptor engagement

Affiliations

Mathematical modelling of cell-fate decision in response to death receptor engagement

Laurence Calzone et al. PLoS Comput Biol. .

Abstract

Cytokines such as TNF and FASL can trigger death or survival depending on cell lines and cellular conditions. The mechanistic details of how a cell chooses among these cell fates are still unclear. The understanding of these processes is important since they are altered in many diseases, including cancer and AIDS. Using a discrete modelling formalism, we present a mathematical model of cell fate decision recapitulating and integrating the most consistent facts extracted from the literature. This model provides a generic high-level view of the interplays between NFkappaB pro-survival pathway, RIP1-dependent necrosis, and the apoptosis pathway in response to death receptor-mediated signals. Wild type simulations demonstrate robust segregation of cellular responses to receptor engagement. Model simulations recapitulate documented phenotypes of protein knockdowns and enable the prediction of the effects of novel knockdowns. In silico experiments simulate the outcomes following ligand removal at different stages, and suggest experimental approaches to further validate and specialise the model for particular cell types. We also propose a reduced conceptual model implementing the logic of the decision process. This analysis gives specific predictions regarding cross-talks between the three pathways, as well as the transient role of RIP1 protein in necrosis, and confirms the phenotypes of novel perturbations. Our wild type and mutant simulations provide novel insights to restore apoptosis in defective cells. The model analysis expands our understanding of how cell fate decision is made. Moreover, our current model can be used to assess contradictory or controversial data from the literature. Ultimately, it constitutes a valuable reasoning tool to delineate novel experiments.


Conflict of interest statement

The authors have declared that no competing interests exist.

Figures
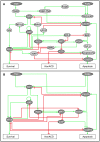
Figure 1
Figure 1. Regulatory networks of cell-fate decision.
(A) Master model: the molecular interactions between the main components intervening in the three pathways are described as an influence graph leading to the three cell fates: survival, non-apoptotic cell death and apoptosis. Dashed lines denote the pathway borders. (B) The corresponding reduced model.
Figure 2
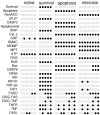
Figure 2. Stable states of the master model.
values 0 and 1 are represented by empty and full circles, respectively.To compare these stable states to those of the simplified model, the values of FADD = 0 need to be deleted since FADD is not explicitly presented in the reduced model. The first six rows (with NonACD = 0, Apoptosis = 0, Survival = 0) correspond to the “naïve” state. The following five rows (with NonACD = 0, Apoptosis = 0, Survival = 1) correspond to ‘survival’. The following eight rows (with NonACD = 0, Apoptosis = 1, Survival = 0) correspond to ‘apoptosis’. The last eight rows (with NonACD = 1, Apoptosis = 0, Survival = 0) correspond to ‘necrosis’.
Figure 3
Figure 3. Projection of the internal stable state values onto the first two principal components.
Four clusters are formed: the ‘naïve’ cluster (round light blue circles) at the center; the survival cluster (green rhombs) characterised by high level of NFκB and related (see Table S1 for details); the apoptosis cluster (orange squares) characterised by high levels of MOMP, Cyt_c, SMAC and ATP; and the non-apoptotic cell death - or necrosis - cluster (purple triangles) with high levels of MPT, ROS, MOMP, Cyt_c and SMAC. In the latter three clusters, there are three subgroups of stable states which correspond to the different inputs of the system: top stable states correspond to high TNF and FAS signals, middle stable states have either one or the other signal while the lower ones have no inputs. As for the naive cluster, the two sets of stable states differ by their cIAP value. Inputs and outputs are not included in the stable state binary vector.
Figure 4
Figure 4. Reachability of phenotypes starting from “physiological” initial conditions.
The colours correspond to the phenotypes as identified by the clustering algorithm (blue: “naïve” survival state; green: survival through NFκB pathway; orange: apoptosis; purple: necrosis). Left panel: TNF = FAS = 0, right panel: TNF = 1 and FAS = 0.
Figure 5
Figure 5. FADD mutant breaks the symmetry of TNF and FAS-induced pathways.
Activation of death receptors in FADD deletion mutant leads to different cell fates depending on the values of TNF and FAS.
Figure 6
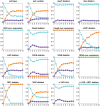
Figure 6. Ligand removal experiments.
The x-axis represents the (discrete) duration of the TNF pulse td (see text). At each discrete time point along the x-axis, the TNF signal is turned off. The different curves represent the average probabilities to reach the different attractors after the pulse (the number of trajectories N = 2000). Curves are coloured in blue for naïve state, green for NFκB survival, orange for apoptosis, and purple for necrosis.
Figure 7
Figure 7. Simplified view of the cell fate model structure.
Left panels: compact regulatory graph deduced from the master model (top), along with two variants (middle and low). Right panels: state transition graphs corresponding to each regulatory graph, using generic logical rules (cf. text). Stable states are represented by ellipses (at the bottom of each state transition graph). Each stable state corresponds to one cell fate: 000 for the ‘naïve’ state, 010 for survival, 001 for apoptosis, and 100 for necrosis. Top: wild type structure. Middle: CASP8 deletion mutant. Bottom: CASP8 deletion mutant in the absence of cIAP.

References

    1. Li M, Beg AA. Induction of necrotic-like cell death by tumor necrosis factor alpha and caspase inhibitors: novel mechanism for killing virus-infected cells. J Virol. 2000;74:7470–7477. - PMC - PubMed
    1. Rehm M, Huber HJ, Hellwig CT, Anguissola S, Dussmann H, et al. Dynamics of outer mitochondrial membrane permeabilization during apoptosis. Cell Death Differ. 2009;16:613–623. - PubMed
    1. Eissing T, Conzelmann H, Gilles ED, Allgower F, Bullinger E, et al. Bistability analyses of a caspase activation model for receptor-induced apoptosis. J Biol Chem. 2004;279:36892–36897. - PubMed
    1. Legewie S, Bluthgen N, Herzel H. Mathematical modeling identifies inhibitors of apoptosis as mediators of positive feedback and bistability. PLoS Comput Biol. 2006;2:e120. - PMC - PubMed
    1. Fussenegger M, Bailey JE, Varner J. A mathematical model of caspase function in apoptosis. Nat Biotechnol. 2000;18:768–774. - PubMed

Publication types

Substances