

Systematic planning of genome-scale experiments in poorly studied species
- PMID: 20221257
- PMCID: PMC2832676
- DOI: 10.1371/journal.pcbi.1000698
Systematic planning of genome-scale experiments in poorly studied species
Abstract
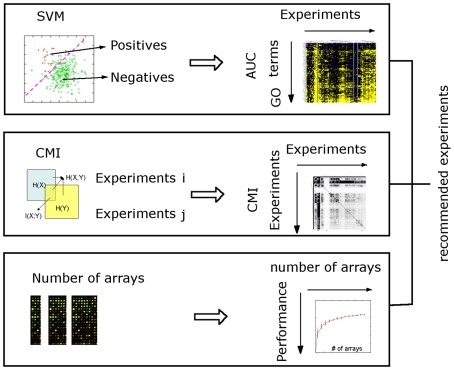
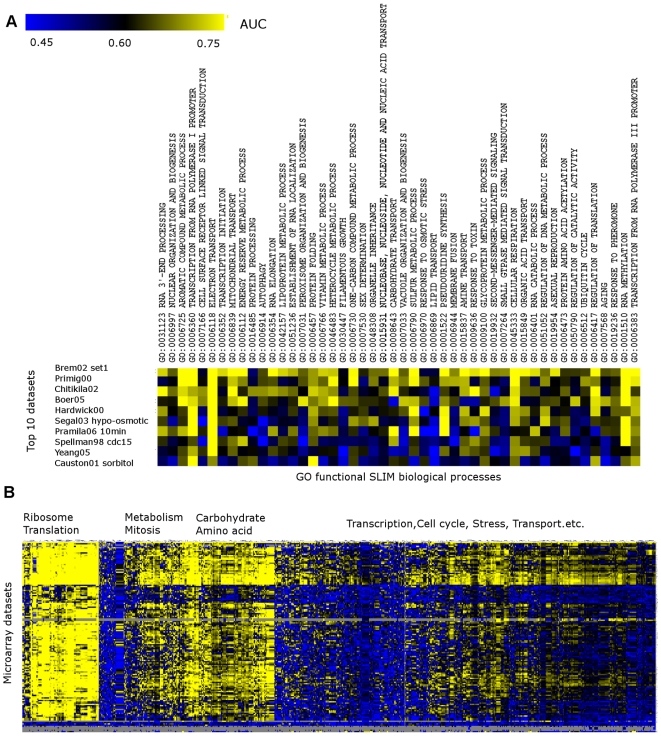
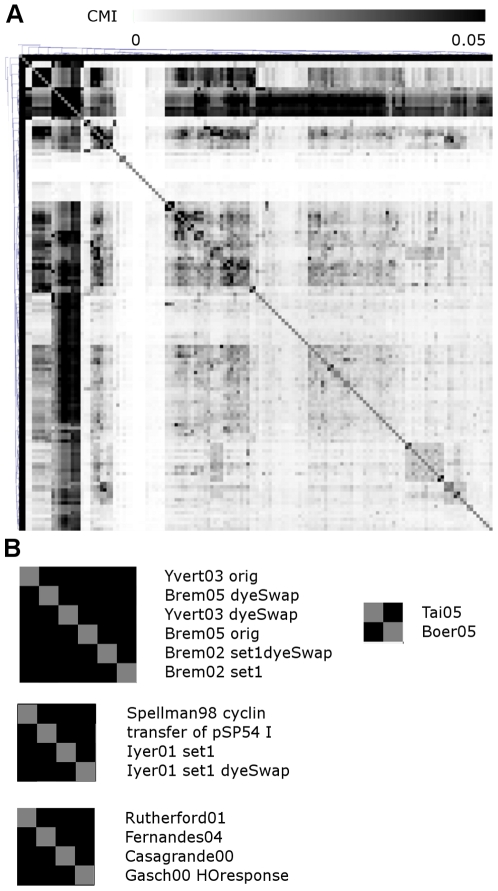
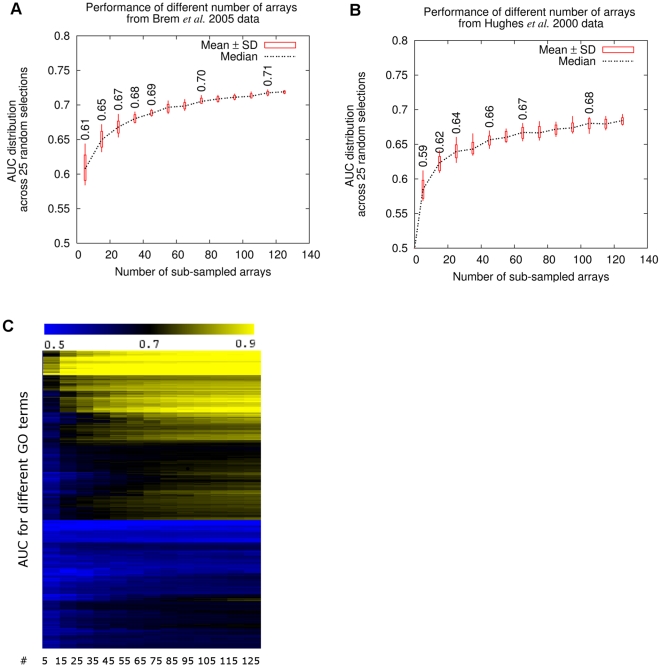
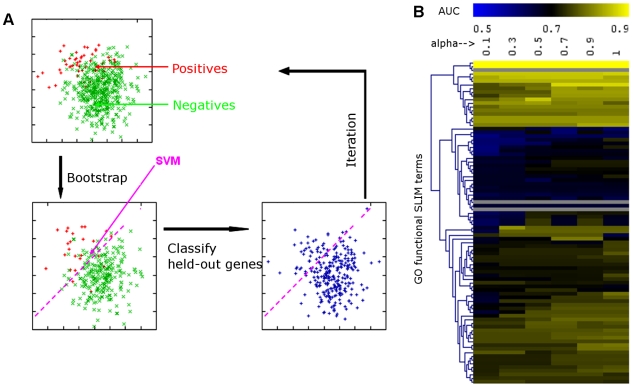
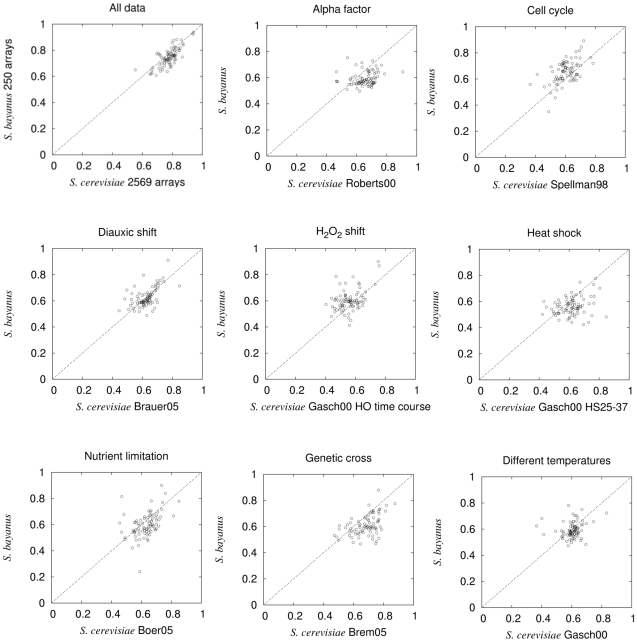
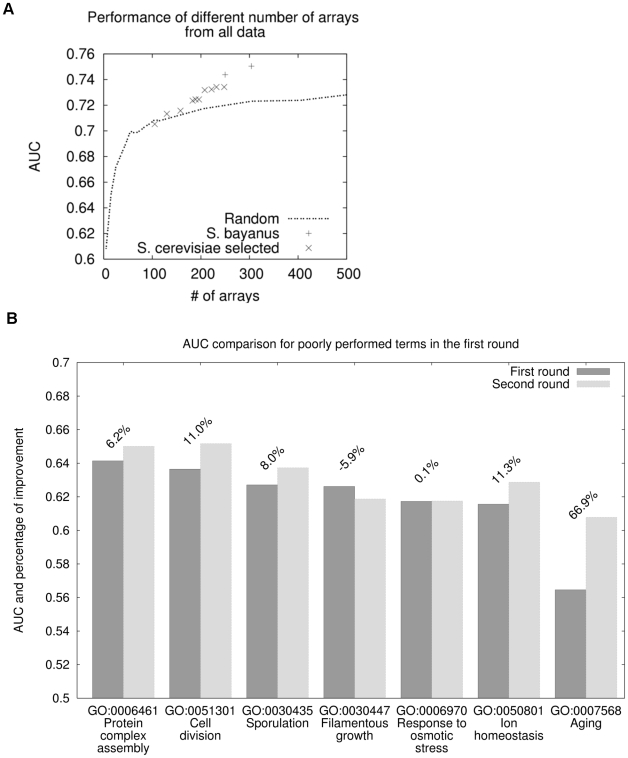
Genome-scale datasets have been used extensively in model organisms to screen for specific candidates or to predict functions for uncharacterized genes. However, despite the availability of extensive knowledge in model organisms, the planning of genome-scale experiments in poorly studied species is still based on the intuition of experts or heuristic trials. We propose that computational and systematic approaches can be applied to drive the experiment planning process in poorly studied species based on available data and knowledge in closely related model organisms. In this paper, we suggest a computational strategy for recommending genome-scale experiments based on their capability to interrogate diverse biological processes to enable protein function assignment. To this end, we use the data-rich functional genomics compendium of the model organism to quantify the accuracy of each dataset in predicting each specific biological process and the overlap in such coverage between different datasets. Our approach uses an optimized combination of these quantifications to recommend an ordered list of experiments for accurately annotating most proteins in the poorly studied related organisms to most biological processes, as well as a set of experiments that target each specific biological process. The effectiveness of this experiment- planning system is demonstrated for two related yeast species: the model organism Saccharomyces cerevisiae and the comparatively poorly studied Saccharomyces bayanus. Our system recommended a set of S. bayanus experiments based on an S. cerevisiae microarray data compendium. In silico evaluations estimate that less than 10% of the experiments could achieve similar functional coverage to the whole microarray compendium. This estimation was confirmed by performing the recommended experiments in S. bayanus, therefore significantly reducing the labor devoted to characterize the poorly studied genome. This experiment-planning framework could readily be adapted to the design of other types of large-scale experiments as well as other groups of organisms.
Conflict of interest statement
The authors have declared that no competing interests exist.
Figures
Comment in
-
Learning to prioritize.Nat Rev Genet. 2010 May;11(5):315. doi: 10.1038/nrg2789. Nat Rev Genet. 2010. PMID: 20414989 No abstract available.
Similar articles
-
A factor analysis model for functional genomics.BMC Bioinformatics. 2006 Apr 21;7:216. doi: 10.1186/1471-2105-7-216. BMC Bioinformatics. 2006. PMID: 16630343 Free PMC article.
-
Constructing and analyzing a large-scale gene-to-gene regulatory network--lasso-constrained inference and biological validation.IEEE/ACM Trans Comput Biol Bioinform. 2005 Jul-Sep;2(3):254-61. doi: 10.1109/TCBB.2005.35. IEEE/ACM Trans Comput Biol Bioinform. 2005. PMID: 17044188
-
Building and analysing genome-wide gene disruption networks.Bioinformatics. 2002;18 Suppl 2:S202-10. doi: 10.1093/bioinformatics/18.suppl_2.s202. Bioinformatics. 2002. PMID: 12386004
-
[Decade of genomics--methods for genome investigation in yeast Saccharomyces cerevisiae].Postepy Biochem. 2006;52(4):435-47. Postepy Biochem. 2006. PMID: 17536513 Review. Polish.
-
Yeast-based functional genomics and proteomics technologies: the first 15 years and beyond.Biotechniques. 2006 May;40(5):625-44. doi: 10.2144/000112151. Biotechniques. 2006. PMID: 16708762 Review.
Cited by
-
Computationally Driven Experimental Biology.Computer (Long Beach Calif). 2012 Mar;45(3):22-23. doi: 10.1109/mc.2012.93. Computer (Long Beach Calif). 2012. PMID: 24976642 Free PMC article.
-
Comparative gene expression between two yeast species.BMC Genomics. 2013 Jan 16;14:33. doi: 10.1186/1471-2164-14-33. BMC Genomics. 2013. PMID: 23324262 Free PMC article.
-
Multiple genetic interaction experiments provide complementary information useful for gene function prediction.PLoS Comput Biol. 2012;8(6):e1002559. doi: 10.1371/journal.pcbi.1002559. Epub 2012 Jun 21. PLoS Comput Biol. 2012. PMID: 22737063 Free PMC article.
-
Combinatorial Cis-regulation in Saccharomyces Species.G3 (Bethesda). 2016 Jan 15;6(3):653-67. doi: 10.1534/g3.115.024331. G3 (Bethesda). 2016. PMID: 26772747 Free PMC article.
-
Commitment to a cellular transition precedes genome-wide transcriptional change.Mol Cell. 2011 Aug 19;43(4):515-27. doi: 10.1016/j.molcel.2011.06.024. Mol Cell. 2011. PMID: 21855792 Free PMC article.
References
-
- Hibbs MA, Hess DC, Myers CL, Huttenhower C, Li K, et al. Exploring the functional landscape of gene expression: directed search of large microarray compendia. Bioinformatics. 2007;23:2692–2699. - PubMed
Publication types
MeSH terms
Substances
Grants and funding
LinkOut - more resources
Full Text Sources
Molecular Biology Databases
