. 2010 Mar 5;6(3):e1000797.
doi: 10.1371/journal.ppat.1000797.

Fine-tuning translation kinetics selection as the driving force of codon usage bias in the hepatitis A virus capsid

Affiliations

Fine-tuning translation kinetics selection as the driving force of codon usage bias in the hepatitis A virus capsid

Lluís Aragonès et al. PLoS Pathog. .

Abstract

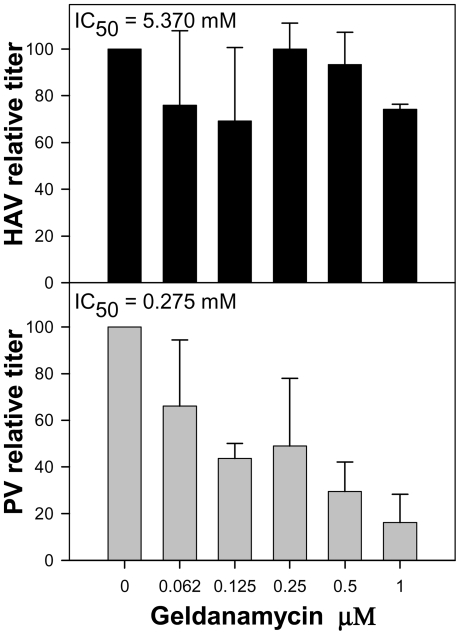
Hepatitis A virus (HAV), the prototype of genus Hepatovirus, has several unique biological characteristics that distinguish it from other members of the Picornaviridae family. Among these, the need for an intact eIF4G factor for the initiation of translation results in an inability to shut down host protein synthesis by a mechanism similar to that of other picornaviruses. Consequently, HAV must inefficiently compete for the cellular translational machinery and this may explain its poor growth in cell culture. In this context of virus/cell competition, HAV has strategically adopted a naturally highly deoptimized codon usage with respect to that of its cellular host. With the aim to optimize its codon usage the virus was adapted to propagate in cells with impaired protein synthesis, in order to make tRNA pools more available for the virus. A significant loss of fitness was the immediate response to the adaptation process that was, however, later on recovered and more associated to a re-deoptimization rather than to an optimization of the codon usage specifically in the capsid coding region. These results exclude translation selection and instead suggest fine-tuning translation kinetics selection as the underlying mechanism of the codon usage bias in this specific genome region. Additionally, the results provide clear evidence of the Red Queen dynamics of evolution since the virus has very much evolved to re-adapt its codon usage to the environmental cellular changing conditions in order to recover the original fitness.


Conflict of interest statement

The authors have declared that no competing interests exist.

Figures

Figure 1
Figure 1. Abundance (percent) of total cytoplasmic RNA and mRNA from two house-keeping genes (GAPDH and HPRT-I) in uninfected FRhK-4 cell monolayers growing in the absence of AMD, in the presence of 0.05 µg/ml and 0.2 µg/ml of AMD, and in HAV-infected cells in the absence of the drug.
Figure 2
Figure 2. HAV yield as a measure of viral fitness in the absence and presence of AMD.
A. 0.0 µg/ml of AMD. B. 0.05 µg/ml of AMD. C. 0.2 µg/ml of AMD. Dotted lines depict maximum and minimum virus yields per cell.
Figure 3
Figure 3. PV yield as a measure of viral fitness in the absence and presence of AMD.
A. 0.0 µg/ml of AMD. B. 0.05 µg/ml of AMD. C. 0.2 µg/ml of AMD. Dotted lines depict maximum and minimum virus yields per cell.
Figure 4
Figure 4. HAV adaptation to different AMD conditions.
A. As a control, the virus population was grown in the absence of the drug (0.0 µg/ml of AMD; lineage 0). B. Adaptation of the virus population to 0.05 µg/ml of AMD (0.05 µg/ml of AMD; lineage 1). C. At passage 65, lineage 1 population was transferred to 0.2 µg/ml of AMD (0.05 µg/ml of AMD →0.2 µg/ml AMD; lineage 2). D. At passage 85, lineage 1 population was transferred back to 0.0 µg/ml of AMD (0.05 µg/ml of AMD →0.0 µg/ml of AMD; lineage 3). E. At passage 65, lineage 2 population was transferred back to 0.05 µg/ml of AMD (0.2 µg/ml of AMD →0.05 µg/ml of AMD; lineage 4). Dotted lines depict maximum and minimum virus yields per cell. Arrows depict changes in AMD conditions.
Figure 5
Figure 5. Relative proportion (percentage) of the new generated codons detected during the process of HAV adaptation to AMD.
These codons were sorted as being similarly frequent (black fill), less frequent (gray fill) or more frequent (blue fill) than the original ones with respect to the cell host codon usage. A. Codon usage variation in the capsid region in the absence of AMD (lineage 0). B. Codon usage variation in the capsid region in the presence of 0.05 µg/ml of AMD (lineage 1) from passage 4 to passage 85, and in the presence of 0.2 µg/ml of AMD (lineage 2) from passage 20 (P20') to passage 38 (P38'). C. Codon usage variation in the polymerase region in the absence of AMD (lineage 0). D. Codon usage variation in the polymerase region in the presence of 0.05 µg/ml of AMD (lineage 1) from passage 4 to passage 85, and in the presence of 0.2 µg/ml of AMD (lineage 2) from passage 20 (P20') to passage 38 (P38').
Figure 6
Figure 6. HAV anticodon usage variation in the capsid and polymerase regions during the adaptation to 0.05 µg/ml of AMD.
Anticodons were sorted in three groups based on the cellular anticodon usage: those used by the cell at a proportion above 60%, those used at a proportion between 20 to 60% and those used at a proportion below 20%. The mean percent viral anticodon usage variation was calculated in the mutant spectra with respect to the initial passage for each group of anticodons at each passage. Asterisks depict significant differences (p<0.05) between the codon usage variation in a given passage with respect to the initial passage.
Figure 7
Figure 7. HAV anticodon usage variation in the capsid coding region during the adaptation to 0.2 µg/ml of AMD.
Passage 65 of the population adapted to 0.05 µg/ml of AMD was thereafter passaged in the presence of 0.2 µg/ml of the drug (lineage 2; right column). Left column depicts the behavior of the population in the absence of AMD as baseline control. The percentage of variation of each individual viral anticodon in the mutant spectra with respect to the cellular usage is shown. Mean and standard deviation of the variation of use of those anticodons with the highest level of variation (encircled) is shown.
Figure 8
Figure 8. Growth competition experiments.
A and B. Populations adapted to grow in the absence of AMD (lineage 0) and in the presence of 0.05 µg/ml of AMD (lineage 1) were mixed at different ratios and grown in the absence of AMD or with 0.05 µg/ml of AMD. Initial population mixture ratios were 1∶1 (lineage 0: lineage 1) in A, and 100∶1 (lineage 0: lineage 1) and 1∶100 (lineage 0: lineage 1) in B. C and D. Populations adapted to grow with 0.05 µg/ml (lineage 1) and 0.2 µg/ml of AMD (lineage 2) were mixed at different ratios and grown in the presence of 0.05 µg/ml of AMD or with 0.2 µg/ml of AMD. Initial population mixture ratios were 1∶1 (lineage 1: lineage 2) in C, and 100∶1 (lineage 1: lineage 2) and 1∶100 (lineage 1: lineage 2) in D.
Figure 9
Figure 9. Relative infectious virus production per cell of HAV and PV in the presence of increasing concentrations of geldanamycin, a heat-shock protein 90 (Hsp90) inhibitor.
Viral production at each geldanamycin concentration is expressed as a percentage of viral production in the absence of the drug.

Similar articles

Cited by

References

    1. Grantham R, Gautier C, Gouy M, Mercier R, Pave A. Codon catalog usage and the genome hypothesis. Nucl Acids Res. 1980;8:197–19c. - PMC - PubMed
    1. Grantham R, Gautier C, Gouy M. Codon frequencies in 119 individual genes confirm corsistent choices of degenerate bases according to genome type. Nucl Acids Res. 1980;8:1893–1912. - PMC - PubMed
    1. Ikemura T. Correlation between the abundance of Escherichia coli transfer RNAs and the occurrence of the respective codons in its protein genes. J Mol Biol. 1981;146:1–21. - PubMed
    1. Bennetzen JL, Hall BD. Codon selection in yeast. J Biol Chem. 1982;257:3026–3031. - PubMed
    1. Moriyama EN, Powell JR. Codon Usage Bias and tRNA Abundance in Drosophila. J Mol Evol. 1997;45:514–523. - PubMed

Publication types

MeSH terms