. 2010 May;214(4):339-53.
doi: 10.1007/s00429-010-0247-z. Epub 2010 Mar 12.

Cytoarchitectonic and chemoarchitectonic characterization of the prefrontal cortical areas in the mouse

Affiliations

Cytoarchitectonic and chemoarchitectonic characterization of the prefrontal cortical areas in the mouse

H J J M Van De Werd et al. Brain Struct Funct. 2010 May.

Abstract

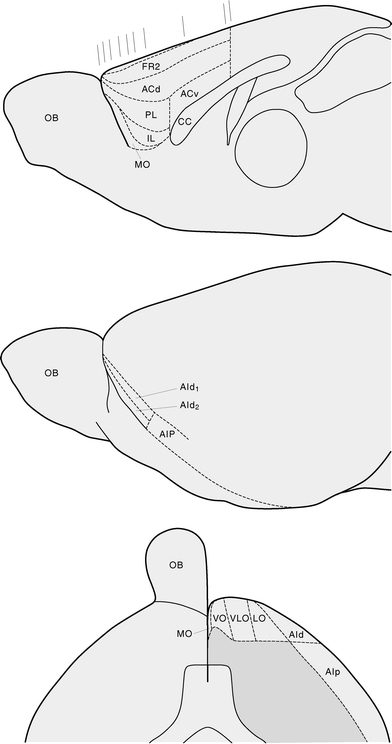
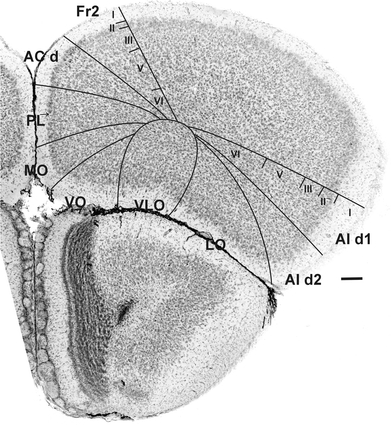
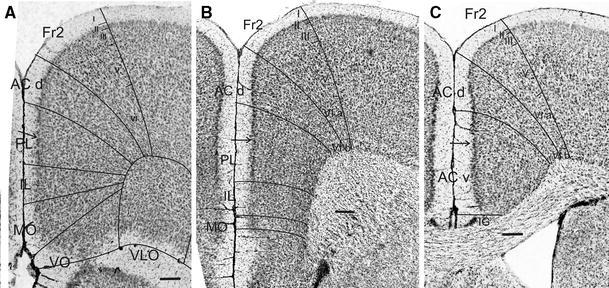
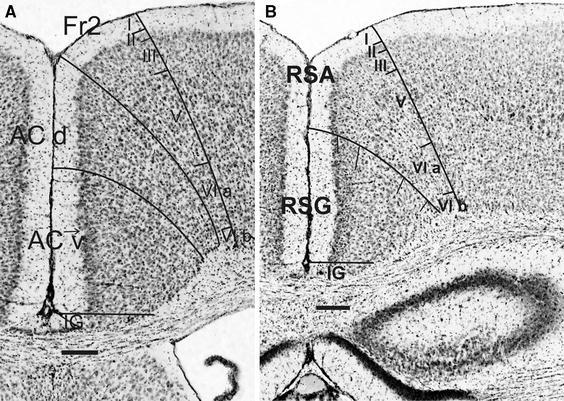
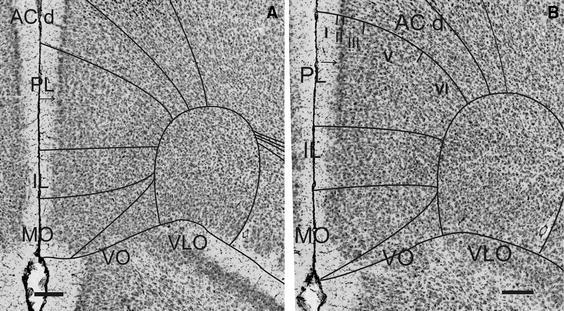
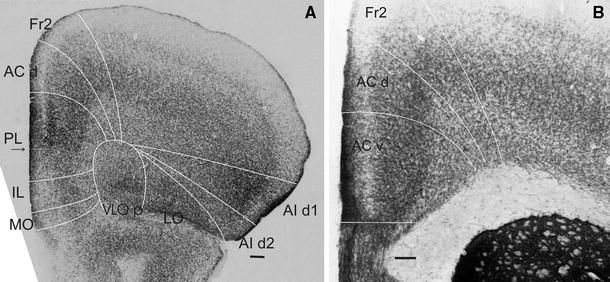
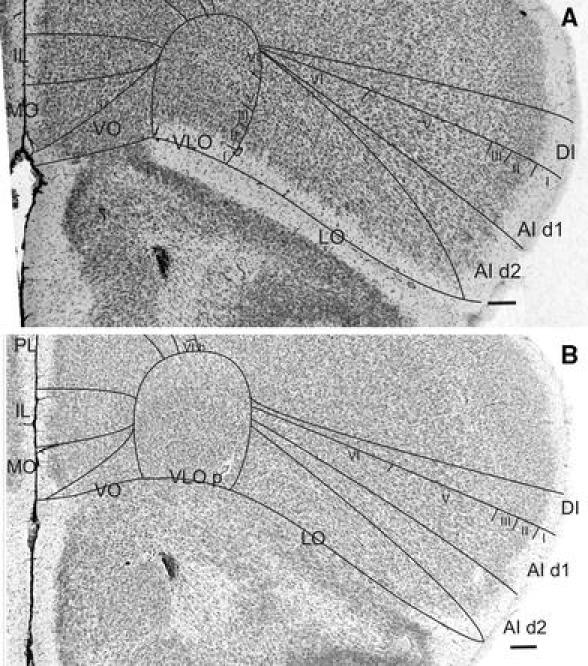
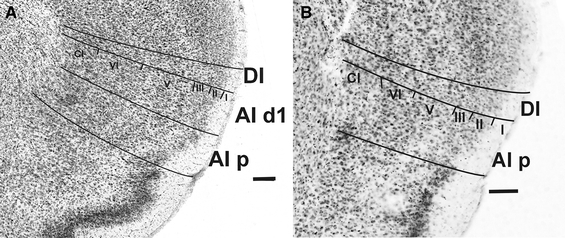
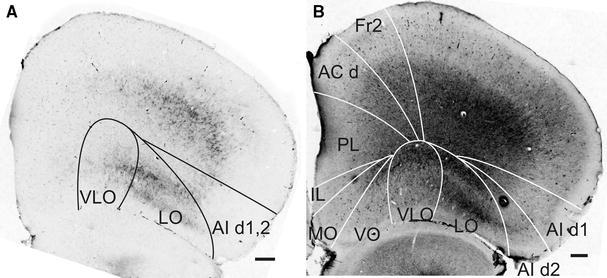
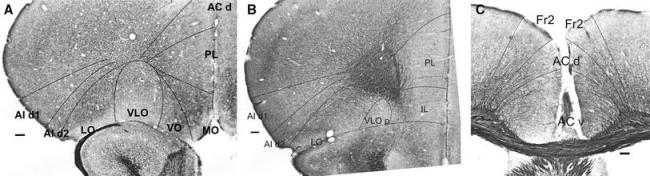
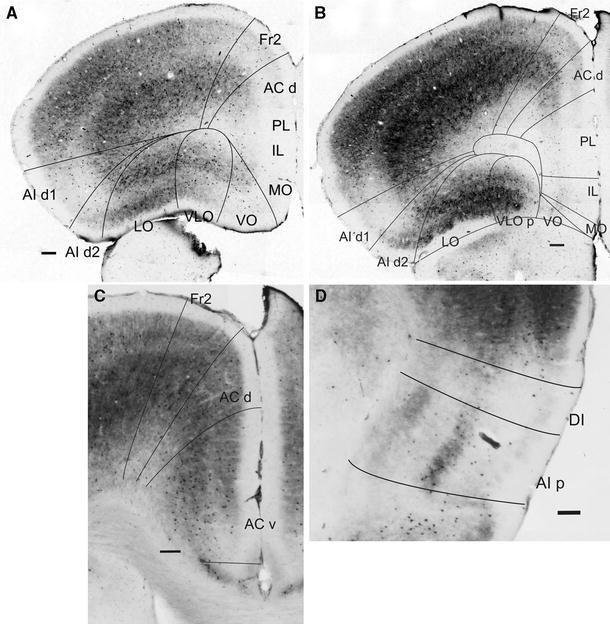
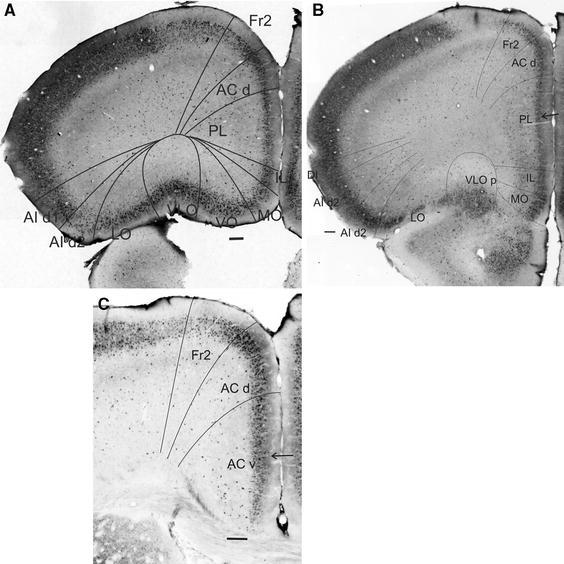
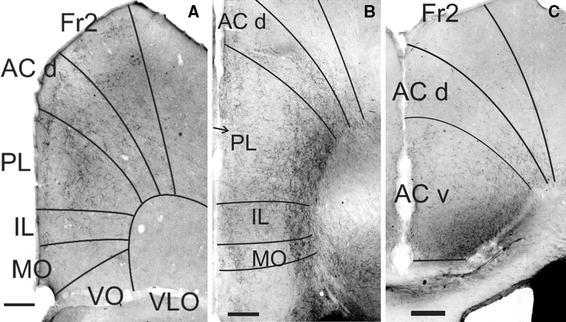
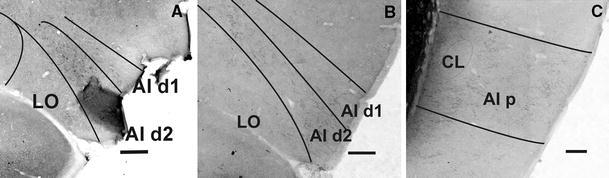
This study describes cytoarchitectonic criteria to define the prefrontal cortical areas in the mouse brain (C57BL/6 strain). Currently, well-illustrated mouse brain stereotaxic atlases are available, which, however, do not provide a description of the distinctive cytoarchitectonic characteristics of individual prefrontal areas. Such a description is of importance for stereological, neuronal tracing, and physiological, molecular and neuroimaging studies in which a precise parcellation of the prefrontal cortex (PFC) is required. The present study describes and illustrates: the medial prefrontal areas, i.e., the infralimbic, prelimbic, dorsal and ventral anterior cingulate and Fr2 area; areas of the lateral PFC, i.e., the dorsal agranular insular cortical areas and areas of the ventral PFC, i.e., the lateral, ventrolateral, ventral and medial orbital areas. Each cytoarchitectonically defined boundary is corroborated by one or more chemoarchitectonic stainings, i.e., acetylcholine esterase, SMI32, SMI311, dopamine, parvalbumin, calbindin and myelin staining.


Figures

Fig. 1
Fig. 1
Schematic view of PFC areas. Top panel medial view; middle panel lateral view; and lower panel orbital view. The lines above the medial view mark the positions of the ten sections shown in Fig. 2. For abbreviations, see “Abbreviations”
Fig. 2
Fig. 2
Overview of PFC subareas in Nissl-stained sections at ten different levels indicated in Fig. 1. For abbreviations, see “Abbreviations”. Scale bar 1 mm
Fig. 3
Fig. 3
Section through the frontal pole. In the medial part of granular Fr1, layer V moves to a more superficial position due to the diminishing layer IV. In Fr2, the cells of layer II are more homogeneously separated from layer I than in Fr1. In ACd and in dorsal PL, the cells of layer II are densely packed on the border with layer I, but the cells of layer III are more densely packed in PL than in ACd. Arrow indicates the border between dorsal PL and ventral PL. In ventral PL, layer II is wider and less densely packed. In VLO, the columns in layers II and III distinguish this area from VO and LO. See also the clustering of layer II cells in LO, the wide loosely packed cells of layer II in AId 2 and the densely packed layer II of AId1. Scale bar 150 μm
Fig. 4
Fig. 4
a Medial PFC at the fusion of the frontal lobe with the retrobulbar region. Layer III cells in ACd are less densely packed than in PL. Arrow indicates the border between dorsal and ventral PL. Layer II in the ventral PL is wider than in the dorsal PL. The cells of layer II are evenly dispersed in MO, but its boundary on layer I and III is less sharp than in Fig. 3. Layer II of area IL extends into layer I. The columns in layers II and III of VLO are typical. b Medial PFC at the level of the forceps minor of corpus callosum. In Fr2 and ACd, the layer VI shows columns, while a horizontal arrangement is visible in PL, IL and MO parallel to pia. Arrow indicates the border between the dorsal and ventral PL C Medial PFC at the supragenual level. In ACd note that layers II and III are denser than in Fr2 and ACv. The columns in ACd are denser in VI and V than in Fr2. Arrow indicates the border between the dorsal ACv and ventral ACv. Layer II is wider in the ventral ACv and layer VI cells are not in columns, but rather in a horizontal arrangement. Scale bars 150 μm
Fig. 5
Fig. 5
a Medial PFC just anterior to i in Fig. 2. The highest point of layer V and a change in layer II are the indications for the boundary between Fr2 and Fr1. The columns in layer VI and the densely packed cells in layer II in ACd differ from the horizontal arrangement of layer VI cells and the wide layer II in ACv. Arrow indicates the border between dorsal ACv and ventral ACv. b Section through the retrosplenial region at the level of j in Fig. 2. Scale bars 150 μm
Fig. 6
Fig. 6
a Ventral part of the medial PFC for details of the areas IL and MO; level: e in Fig. 2. In ACd, the layer II is characteristic, and the columns in layers V and VI are distinguishable albeit with some difficulty. Columns are absent in PL and layer VI of PL is denser. Layers II and III of the dorsal and ventral PL differ in density. Homogeneity of layers is characteristic in IL. In MO, the cells in layer II are equally dispersed. VLO is characterized by columns in layers II and III. b Medial PFC at a level between e and i in Fig. 2. In dorsal PL, layer II is narrower than in ventral PL. Layer VI in PL and IL have a more horizontal arrangement. In IL, homogeneity is mainly seen in layers II and III. In MO, the evenly dispersed cells in the well visible layer II is characteristic. VLO shows the characterizing columns and homogeneity of layers II and III. Arrow indicates the border between the dorsal and ventral PL. Scale bars 150 μm
Fig. 7
Fig. 7
Acetylcholinesterase staining. a Section through the frontal lobe. The strongest staining is in dorsal PL and in AId1. In ACd and Fr2, staining is mainly seen in layer V. Staining in the ventral PL, IL and MO is light and mainly in layer V. In VLOp, staining is mainly in the lateral part. In LO, staining is seen in layer V and in the superficial layers. Area AId2 shows less staining than its neighboring areas. Arrow indicates the border between the dorsal and ventral PL. b Medial PFC at the start of ACv. In ACd, staining is less than ACv and mainly deep in layer V; in Fr2, staining is less than in ACd. Scale bars 150 μm
Fig. 8
Fig. 8
a Orbital and lateral areas of the PFC at the anterior fusion of the frontal lobe with the retrobulbar region. Typical features are the columns and the homogeneity in the layers II and III of VLO, the clusters of cells in layer II of LO, the loose layer II of AId 2 with cells spreading into layer I and densely packed columns, the wide and rather homogeneous layer II of AId 1 and the less densely packed columns in the lower layers. b The same areas at a more posterior level: f in Fig. 2. Typical features are the homogeneity of IL, the sharply outlined layer II with evenly dispersed cells in MO and the homogeneity of VLOp. Scale bars 150 μm
Fig. 9
Fig. 9
a Lateral PFC at the transition to AIp. Typical are the clearly distinguishable (sub)layers of AIp and the columns in AId1. b AIp posterior to the PFC, CL claustrum. In DI, layers II, III and IV are homogeneous. Scale bars 150 μm
Fig. 10
Fig. 10
a Section through the frontal lobe, stained by SMI-32. Layers III and V are well stained in LO. In VLO, staining is seen mainly in the lateral part; in AId, staining is limited to the deepest part of layer V; and in the medial PFC subareas, very sparse staining is present. b Section at the corresponding level, stained by SMI-311. Staining is strongest in LO, and in VLO staining is more in its lateral part. In Fr2, many large neurons are stained in layer V. PL shows less staining than ACd and Fr2. AId1 and AId2 show only few stained cells. Scale bars 150 μm
Fig. 11
Fig. 11
Myelin-stained sections. a Section through the frontal lobe. Nerve fibers are most strongly stained in LO. Sparsest staining is present in VLO. b At the level of the forceps minor of the corpus callosum. The nerve fibers are most strongly stained in LO. c Supracallosal PFC. Longest and most densely packed fibers are seen in Fr2 and ACd; in ACv, fibers are shorter and less densely packed. Scale bars 150 μm
Fig. 12
Fig. 12
Parvalbumin-stained sections. a Level of the frontal lobe. Strongest staining in LO and lateral part of VLO. In AId1 and AId2, sparse cells are seen in nearly all the layers. This is also seen in VO. b Level after fusion of the frontal lobe with the retrobulbar region. Strongest staining in LO and VLOp. Staining of cells in deep layers more in AId2 than in AId1. c Supracallosal PFC. Parvalbumin-positive cells in ACv are much more packed than in ACd or Fr2. d Level of AIp. Most cells are seen in layer V of AIp. Scale bars 150 μm
Fig. 13
Fig. 13
Calbindin-stained sections. Boundaries have been extrapolated from Nissl-stained sections. Except for columns and densely packed cells in VLO and clustering of cells in LO and MO, typical features for identifying areas are not abundant. a Level of frontal pole. Small cells in AId2, clusters in layer II in LO, and in VLO densely packed cells and columns. b Level after fusion of the frontal lobe with the retrobulbar region. Densely packed cells in AId2, clusters of cells in LO and homogeneity of cells in VLOp. Arrow indicates border between the dorsal and ventral PL. c Supracallosal PFC. Concentration of cells of layer II at the boundary with layer I characterizes ACd. No strong staining in Fr2 and ACv. Arrow indicates the border between the dorsal and ventral ACv, extrapolated from Nissl staining in the adjacent section. Scale bars 150 μm
Fig. 14
Fig. 14
Dopamine-stained sections. a Frontal lobe. Dopamine-stained fibers present in all areas of the medial PFC, especially in PL. b Medial PFC at the pregenual level. Dopaminergic fibers in all areas of the medial PFC, especially in layer VI in PL. Arrow indicates the border between the dorsal and ventral PL, extrapolated from Nissl staining in the adjacent section. Fiber density in layer V in the ventral PL was higher than that in the dorsal PL. c Supracallosal PFC. Dopaminergic fibers were mostly in ACv and less in ACd and Fr2. Scale bars 150 μm
Fig. 15
Fig. 15
Dopamine staining. a The abundance of dopaminergic fibers in AId2. b Dopaminergic fibers are abundant in AId2 and less in AId1 and LO. c AIp shows dopaminergic fibers in all layers, but no dopamine is seen in the claustrum. Scale bars 150 μm

Similar articles

Cited by

References

    1. Airey DC, Robbins AI, Enzinger KM, Wu F, Collins CE. Variation in the cortical area map of C57BL/6J and DBA/2J inbred mice predicts strain identity. BMC Neurosci. 2005;6:18. doi: 10.1186/1471-2202-6-18. - DOI - PMC - PubMed
    1. Amargós-Bosch M, Bortolozzi A, Puig MV, Serrats J, Adell A, Celada P, Toth M, Mengod G, Artigas F. Co-expression and in vivo interaction of serotonin1A and serotonin2A receptors in pyramidal neurons of prefrontal cortex. Cereb Cortex. 2004;14:281–299. doi: 10.1093/cercor/bhg128. - DOI - PubMed
    1. Barrett D, Shumake J, Jones D, Gonzalez-Lima F. Metabolic mapping of mouse brain activity after extinction of a conditioned emotional response. J Neurosci. 2003;23:5740–5749. - PMC - PubMed
    1. Bohland JW, Wu C, Barbas H, Bokil H, Bota M, et al. A proposal for a coordinated effort for the determination of brainwide neuroanatomical connectivity in model organisms at a mesoscopic scale. PLoS Comput Biol. 2009;5(3):e1000334. doi: 10.1371/journal.pcbi.1000334. - DOI - PMC - PubMed
    1. Cavada C, Comañy T, Hernández-González A, Reinoso-Suárez F. Acetylcholinesterase histochemistry in the macaque thalamus reveals territories selectively connected to frontal, parietal and temporal association cortices. J Chem Neuroanat. 1995;8:245–257. doi: 10.1016/0891-0618(95)00050-H. - DOI - PubMed

Publication types