. 2010 Jul;38(7):2346-57.
doi: 10.1007/s10439-010-9993-6. Epub 2010 Mar 11.

Electrocardiogram signals to assess zebrafish heart regeneration: implication of long QT intervals

Affiliations

Electrocardiogram signals to assess zebrafish heart regeneration: implication of long QT intervals

Fei Yu et al. Ann Biomed Eng. 2010 Jul.

Abstract

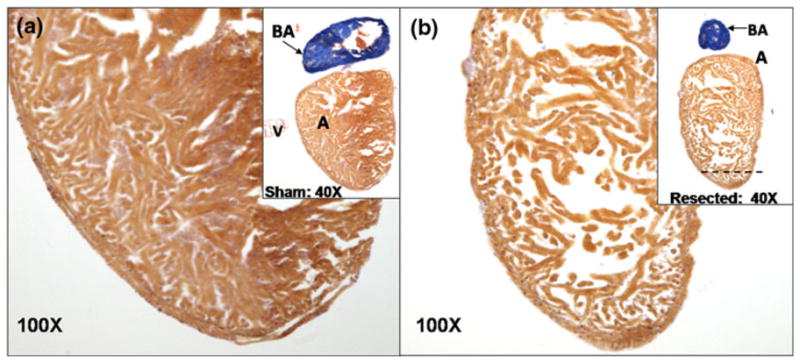
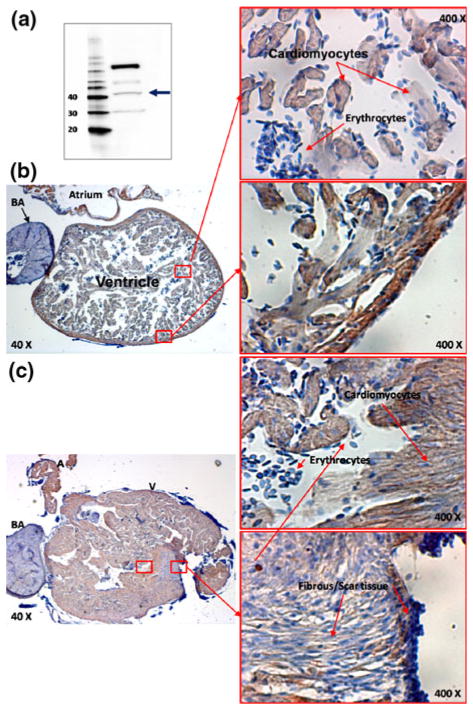
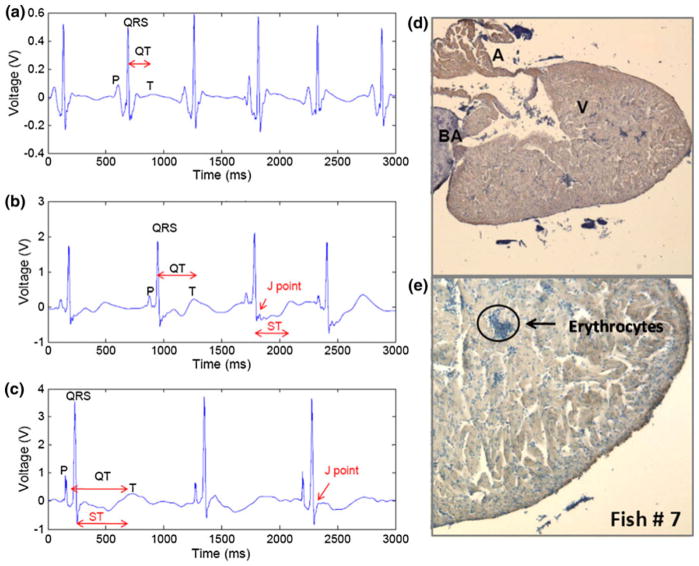
Zebrafish is an emerging model system for cardiac conduction and regeneration. Zebrafish heart regenerates after 20% ventricular resection within 60 days. Whether cardiac conduction phenotype correlated with cardiomyocyte regeneration remained undefined. Longitudinal monitoring of the adult zebrafish heart (n = 12) was performed in terms of atrial contraction (PR intervals), ventricular depolarization (QRS complex) and repolarization (heart rated corrected QTc interval). Baseline electrocardiogram (ECG) signals were recorded one day prior to resection and twice per week over 59 days. Immunostaining for gap junctions with anti-Connexin-43 antibody was compared between the sham (n = 5) and ventricular resection at 60 days post-resection (dpr) (n = 7). Heart rate variability, QTc prolongation and J-point depression developed in the resected group but not in the sham. Despite a trend toward heart rate variability in response to ventricular resection, the differences between the resected and sham fish were, by and large, statistically insignificant. At 10 dpr, J-point depression was statistically significant (sham: -0.179 +/- 0.061 mV vs. ventricular resection: -0.353 +/- 0.105 mV, p < 0.01, n = 7). At 60 days, histology revealed either cardiomyocyte regeneration (n = 4) or scar tissues (n = 3). J-point depression was no longer statistically significant at 59 dpr (sham: -0.114 +/- 0.085 mV; scar tissue: -0.268 +/- 0.178 mV, p > 0.05, n = 3; regeneration: -0.209 +/- 0.119 mV, p > 0.05, n = 4). Despite positive Connexin-43 staining in the regeneration group, QTc intervals remained prolonged (sham: 325 +/- 42 ms, n = 5; scar tissues: 534 +/- 51 ms, p < 0.01, n = 3; regeneration: 496 +/- 31 ms, p < 0.01, n = 4). Thus, we observed delayed electric repolarization in either the regenerated hearts or scar tissues. Moreover, early regenerated cardiomyocytes lacked the conduction phenotypes of the sham fish.


Figures

FIGURE 1
FIGURE 1
Histological study of sham vs. ventricular resection at 60 dpr. (a) Acid fuchsin orange G (AFOG) staining of heart from the sham. Inset shows the ventricle at 100×. (b) AFOG staining of the regenerated ventricle. Dotted line indicates the region of ventricular resection. Inset highlights regenerated ventricle at 100×. The ventricle revealed cardiomyocyte regeneration as reported by Poss et al. Although endo-, mid- and epicardial layers seemed indistinct, trabeculation was notable in zebrafish heart. The variations in cardiomyocyte “density” or otherwise known as wall thickness were mainly due the different cardiac contractile stage between systole and diastole at which the heart was arrested and fixed for histology preparation. A, atrium; V, ventricle; BA, bulbus arteriosus.
FIGURE 2
FIGURE 2
Immunohistochemistry for cardiomyocyte gap junction protein, Connexin-43. (a) Western blots indicated a band corresponding to the molecular weight of Connexin-43. However, the antibody for zebrafish Connext-43 is not specific as notable for other bands. (b) Atrium and ventricle were surrounded by light brown staining whereas bulbus arteriosus was in light blue staining. Magnification (400×) revealed light born staining in the individual cardiomyocytes and striation was prevalent. Zebrafish erythrocytes are nucleated and stained in dark blue. (c) Immunohistochemistry on incompletely regenerated heart on 60 dpr. Low magnification (40×) presented bulbus arteriosus (BA) as well as pericardial tissue in blue, atrium and ventricle in brown; magnification (400×) revealed ventricular cavity and incomplete ventricle boundary in details. CX43 negative scar tissue with minimal brown staining with prominent nuclei was present near the injured site.
FIGURE 3
FIGURE 3
Example of signal processing for fish #11 ECG recorded at 3 dpa. (a) Raw signal directly recorded from sedated zebrafish using Labview at sampling rate of 1000 Hz. (b) Breakdown of raw signals into frequency segments via wavelet transform. Low frequency signals (DC to 0.49 Hz) were completely filtered. Thresholds were applied to each of the individual frequency ranges to suppress corresponding noise levels. Sub-threshold values were set to zero. Signals within frequency range from 0.98 to 7.81 Hz were reserved to ensure fidelity of T-waves. (c) Reconstructed ECG signals from processed frequency segments were shown after applying inverse wavelet transform.
FIGURE 4
FIGURE 4
Representative ECG recording from sham operation fish. (a) ECG recording at 0 dpr revealed P waves and QRS complexes. T waves were visible but not prominent. (b) ECG recording at 31 dpr revealed that P waves, QRS intervals, and T waves were statistically similar to the baseline ECG recording. (c) ECG recordings at 59 dpr revealed that P wave, QRS complexes and QTc intervals remained statistically unchanged. (d) Immunohistochemistry for cardiomyocyte gap junction protein, Connexin-43, at 60 dpr disclosed light brown staining in both atrium and ventricle at 40×. Bulbus arteriosus was in light blue staining. (e) The ventricle remained intact post the sham operation at 100×. The nucleated erythrocytes were stained dark blue.
FIGURE 5
FIGURE 5
Representative ECG recording of fish with incomplete regeneration or residual resection. (a) ECG prior to resection showed distinct P waves, QRS complexes, and T waves. (b) ECG at 31 dpr revealed QTc, prolongation, J point and ST depression. (c) ECG at 59 dpr demonstrated persistent QTc prolongation, J point and ST depression, as well as prominent T waves. (d) Immunohistochemistry revealed scar tissues at ill-defined boarder at 40×. (e) At 100× CX43 negative scar tissue with minimal brown staining with prominent nuclei was present near the injured site. Red arrows point to the blue staining suggesting scar tissues in the resected region.
FIGURE 6
FIGURE 6
Representative ECG recording from fish with ventricular regeneration. (a) ECG before ventricular resection displayed distinct P waves, followed by QRS complexes. T waves were not distinguishable. (b) ECG at 31 dpr showed that P waves and QRS complexes remained unchanged, suggesting intact atrial and ventricular depolarization. However, prominent T waves developed and QTc intervals became prolonged. ST segment depression was evidenced by the J-point depression. (c) ECG at 59 dpr showed that QTc intervals remained prolonged, and that ST segment appeared to normalize to baseline. Tall P wave amplitudes were likely due to electrode placement proximal to the source of sinus node pacemaker cells. Note that variations in voltage amplitude at various days post-resection were likely due to lead placements. (d) Immunohistochemistry at 60 dpr revealed light brown staining for Connexin-43 in both atrium and ventricle in contrast to light blue staining for bulbus arteriosus at 40×. (e) Complete cardiomyocyte regeneration was noted despite persistent prolonged QTc intervals at 100×.
FIGURE 7
FIGURE 7
Effect of resection on the variability of RR intervals. Variability, Var, was calculated as the standard deviation of RR interval divided by the mean RR interval. Higher Var value indicates greater variability. Mean and standard deviation of Var values for sham-operated and resected fish were presented against the numbers of day post-resection (dpr). RR variability of sham (n = 5) and resected fish (n = 7) were similar from day 0 to 17 dpr. After 20 dpr, the resected group showed greater Var value. Only 3 time points (27, 52 and 55 dpr) revealed a statistically significant difference.
FIGURE 8
FIGURE 8
Dynamic changes in J-point depression values between sham and resected ventricles. J-point depression (J) was calculated as the difference between J-point and baseline (signal level prior to P wave) and normalized with voltage amplitude of QPS complex. Periodic J values for the sham operation (Control), resected ventricles with regeneration, resected ventricles with scar tissues (Scarred) were plotted over 59 days. “*” indicates statistical significant difference between the sham and regeneration (No Scar) (p<0.01); “#” indicates statistical significant difference between the sham and scar tissues (p <0.01).
FIGURE 9
FIGURE 9
QTc values between sham and resected ventricles. Statistically significant differences developed at 3 dpr (p <0.01, n = 7). While the QTc of sham (blue diamond) remained statistically unchanged ranging from 275 to 350 ms, the mean QTc values for the resected ventricles showed QTc prolongation ranging from 375 ms to 400–600 ms starting at 3 dpr despite cardiomyocyte regeneration at 59 dpr (p<0.01, n = 7).

Similar articles

Cited by

References

    1. Arnaout R, Ferrer T, Huisken J, Spitzer K, Stainier DY, Tristani-Firouzi M, Chi NC. Zebrafish model for human long QT syndrome. Proc Natl Acad Sci USA. 2007;104(27):11316–11321. - PMC - PubMed
    1. Bergmann O, Bhardwaj RD, Bernard S, Zdunek S, Barnabe-Heider F, Walsh S, Zupicich J, Alkass K, Buchholz BA, Druid H, Jovinge S, Frisen J. Evidence for cardiomyocyte renewal in humans. Science. 2009;324(5923):98–102. - PMC - PubMed
    1. Braunwald E, Zipes DP, Libby P. Heart Disease: A Textbook of Cardiovascular Medicine. Philadelphia, PA: W.B. Saunders Company; 2001.
    1. Chang GY, Cao F, Krishnan M, Huang M, Li Z, Xie X, Sheikh AY, Hoyt G, Robbins RC, Hsiai T. Positron emission tomography imaging of conditional gene activation in the heart. J Mol Cell Cardiol. 2007;43(1):18–26. - PMC - PubMed
    1. Chi NC, Shaw RM, Jungblut B, Huisken J, Ferrer T, Arnaout R, Scott I, Beis D, Xiao T, Baier H, Jan LY, Tristani-Firouzi M, Stainier DYR. Genetic and physiologic dissection of the vertebrate cardiac conduction system. PLoS Biol. 2008;6(5):1006–1019. - PMC - PubMed

Publication types