

Use of passive diffusion tubes to monitor air pollutants
- PMID: 20222533
- PMCID: PMC2838214
- DOI: 10.3155/1047-3289.60.2.204
Use of passive diffusion tubes to monitor air pollutants
Abstract
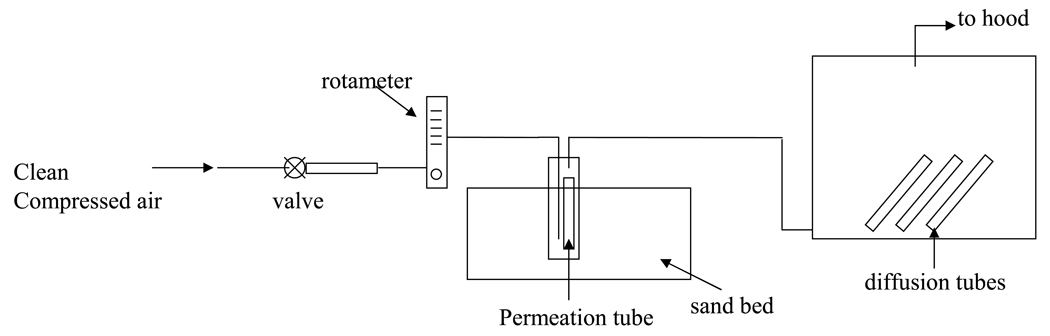
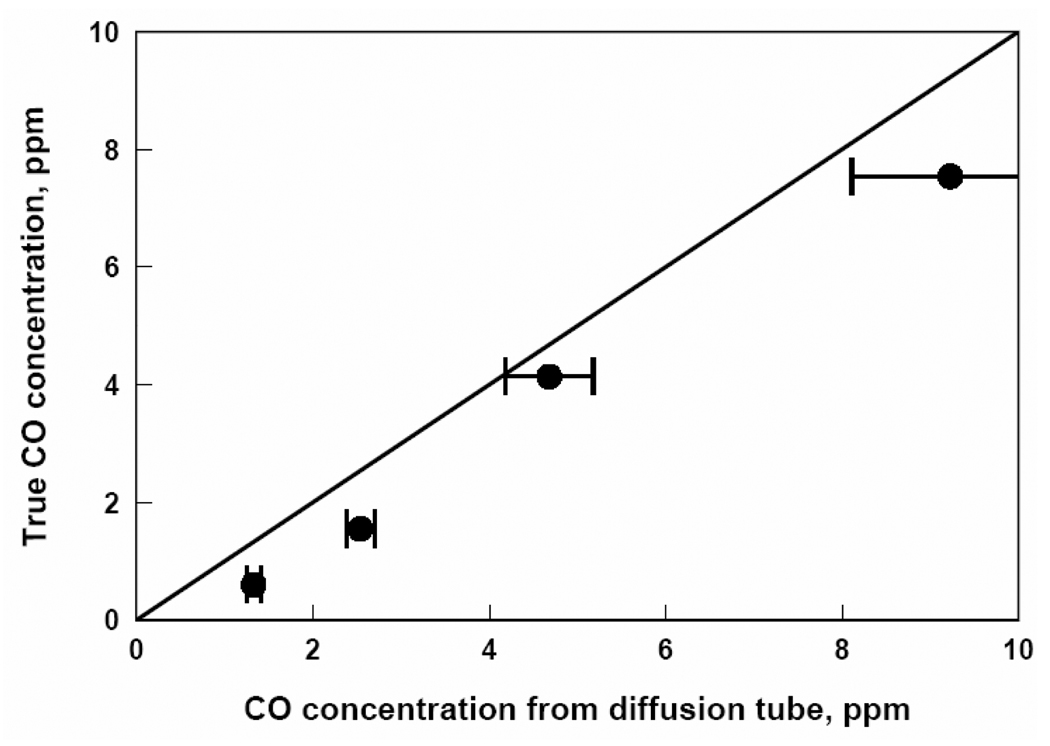
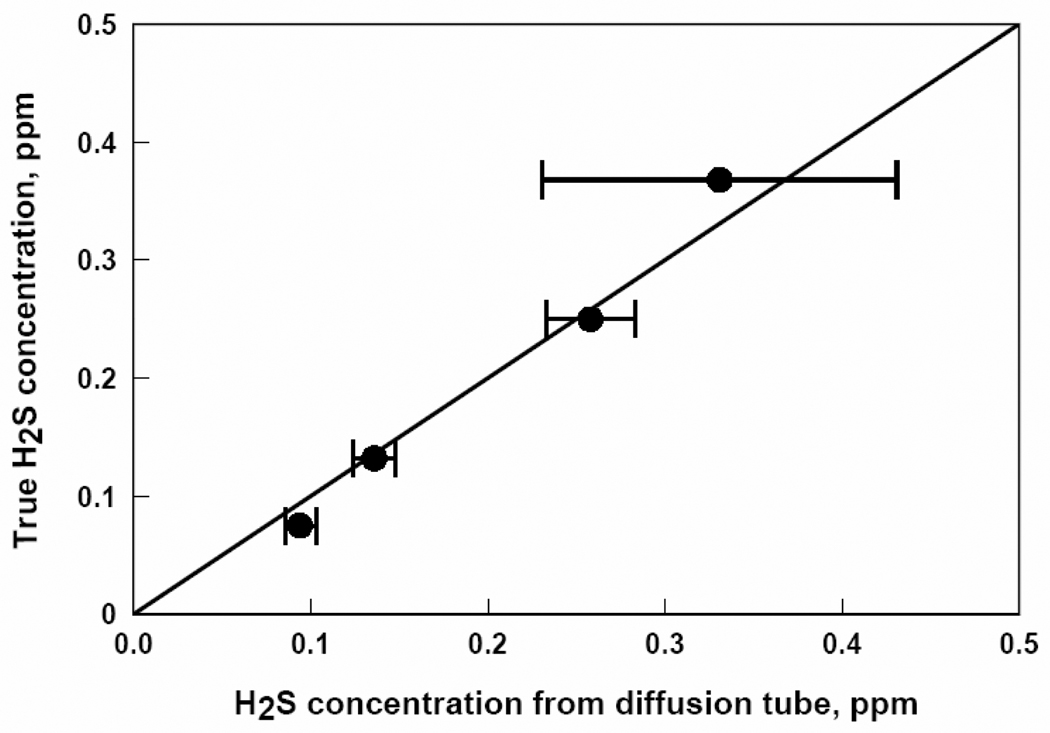
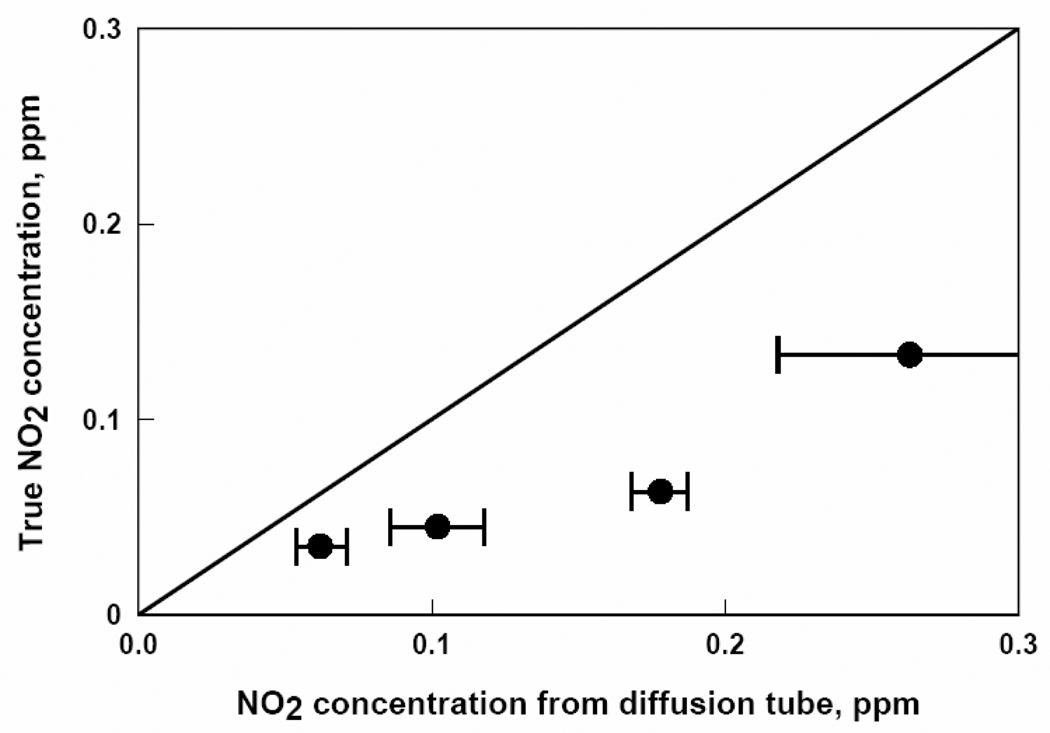
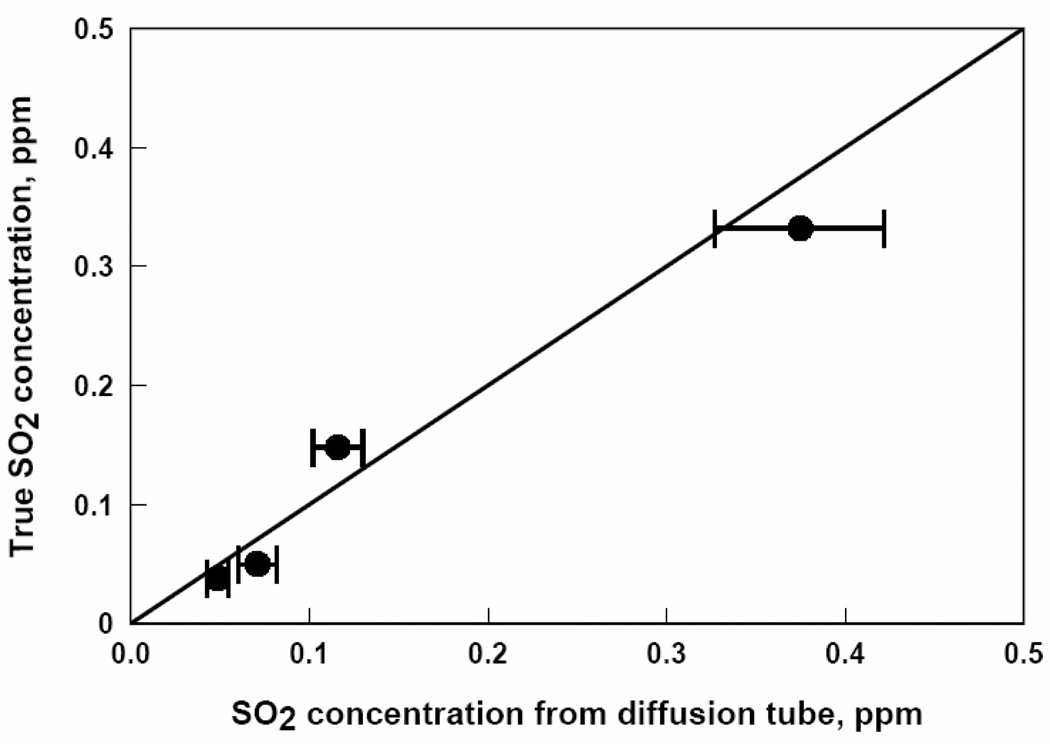
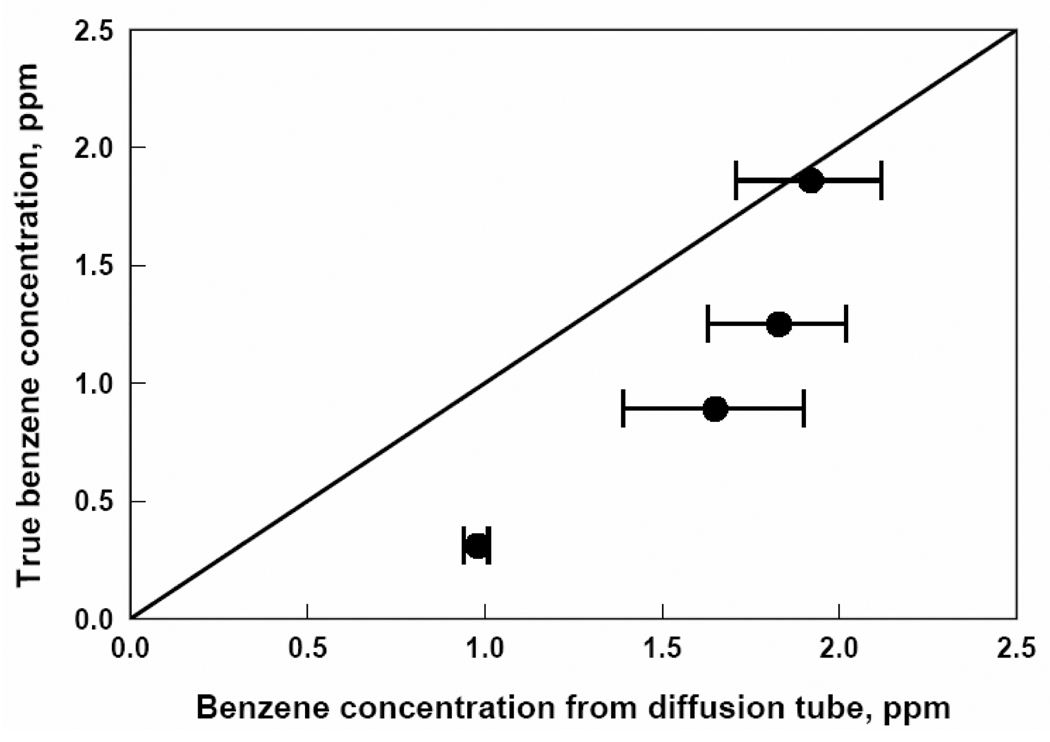
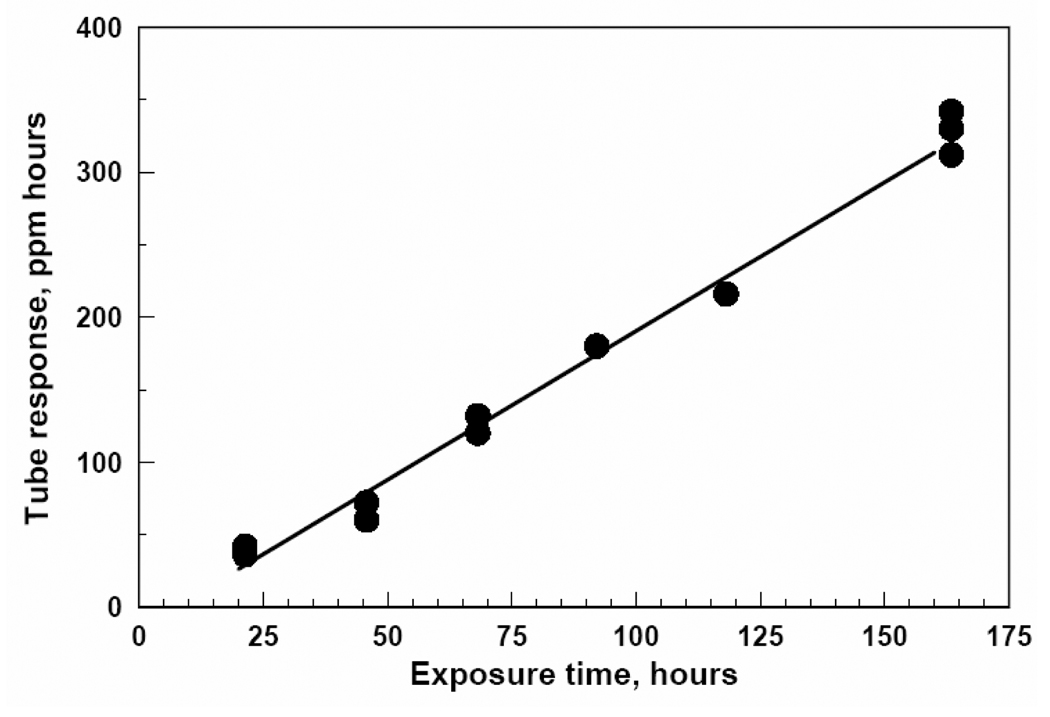
Monitoring gas-phase pollutants is essential to understand exposure patterns and to establish a link between exposure and health. Measurement of the low concentrations found outdoors or in indoor living space normally requires large, expensive instruments that use electrical power. In this study, colorimetric passive diffusion tubes, normally used to monitor high concentrations of airborne contaminants in the workplace for sampling periods of a few hours, were evaluated to measure much lower concentrations of the same pollutants for periods of up to 1 wk. These tubes are small, inexpensive, and require no electrical power. Responses of diffusion tubes for carbon monoxide (CO), hydrogen sulfide (H2S), nitrogen dioxide (NO2), sulfur dioxide (SO2), and benzene were studied. Low pollutant concentrations measured with passive diffusion tubes matched reasonably well with true concentrations for all pollutants except NO2. These results suggest that passive diffusion tubes can provide an inexpensive, unobtrusive, and effective method to monitor low pollutant concentrations. Passive diffusion tubes may be particularly useful in surveys where the spatial variability in concentrations is high and where the cost of traditional monitoring instruments is a concern.
Figures
Similar articles
-
Passive colorimetric dosimeter tubes for ammonia, carbon monoxide, carbon dioxide, hydrogen sulfide, nitrogen dioxide and sulfur dioxide.Am Ind Hyg Assoc J. 1985 Jul;46(7):357-62. doi: 10.1080/15298668591394978. Am Ind Hyg Assoc J. 1985. PMID: 3939731
-
Performances and application of a passive sampling method for the simultaneous determination of nitrogen dioxide and sulfur dioxide in ambient air.Environ Monit Assess. 2002 Nov;79(3):301-15. doi: 10.1023/a:1020205230396. Environ Monit Assess. 2002. PMID: 12392166
-
The impact of the congestion charging scheme on air quality in London. Part 1. Emissions modeling and analysis of air pollution measurements.Res Rep Health Eff Inst. 2011 Apr;(155):5-71. Res Rep Health Eff Inst. 2011. PMID: 21830496
-
Passive dosimeters for nitrogen dioxide in personal/indoor air sampling: a review.J Expo Sci Environ Epidemiol. 2008 Sep;18(5):441-51. doi: 10.1038/jes.2008.22. Epub 2008 Apr 30. J Expo Sci Environ Epidemiol. 2008. PMID: 18446185 Free PMC article. Review.
-
The burden of disease attributable to indoor air pollutants in China from 2000 to 2017.Lancet Planet Health. 2023 Nov;7(11):e900-e911. doi: 10.1016/S2542-5196(23)00215-2. Lancet Planet Health. 2023. PMID: 37940210
Cited by
-
Assessing the Polarising Impacts of Low-Traffic Neighbourhoods: A Community Perspective from Birmingham, UK.Int J Environ Res Public Health. 2024 Dec 9;21(12):1638. doi: 10.3390/ijerph21121638. Int J Environ Res Public Health. 2024. PMID: 39767477 Free PMC article.
-
The Use of the Internet of Things for Estimating Personal Pollution Exposure.Int J Environ Res Public Health. 2019 Aug 28;16(17):3130. doi: 10.3390/ijerph16173130. Int J Environ Res Public Health. 2019. PMID: 31466302 Free PMC article.
-
Indoor air pollutants and health in the United Arab Emirates.Environ Health Perspect. 2012 May;120(5):687-94. doi: 10.1289/ehp.1104090. Epub 2012 Feb 22. Environ Health Perspect. 2012. PMID: 22357138 Free PMC article.
References
-
- McConnaughey PJ, McKee ES, Pritts IM. Passive Colorimetric Dosimeter Tubes for Ammonia, Carbon Monoxide, Carbon Dioxide, Hydrogen Sulfide, Nitrogen Dioxide, and Sulfur Dioxide. Am. Ind. Hyg. Assoc. J. 1985;46(7):357–362. - PubMed
-
- Gastec Handbook: Environmental Analysis Technology. 8th edn. Kanagawa, Japan: Gastec Corporation; 2008. ed.
-
- U.S. Environmental Protection Agency. http://www.epa.gov/air/urbanair/ - PubMed
-
- Woodall GM, Jr, Smith RL, Granville GC. Proceedings of the Hydrogen Sulfide Health Research and Risk Assessment Symposium, October 31-November 2, 2000. Inhal. Toxicol. 2005;17:593–639. - PubMed
Publication types
MeSH terms
Substances
Grants and funding
LinkOut - more resources
Full Text Sources