. 2010 Mar 11:11:36.
doi: 10.1186/1471-2202-11-36.

Top-down and bottom-up modulation in processing bimodal face/voice stimuli

Affiliations

Top-down and bottom-up modulation in processing bimodal face/voice stimuli

Marianne Latinus et al. BMC Neurosci. .

Abstract

Background: Processing of multimodal information is a critical capacity of the human brain, with classic studies showing bimodal stimulation either facilitating or interfering in perceptual processing. Comparing activity to congruent and incongruent bimodal stimuli can reveal sensory dominance in particular cognitive tasks.

Results: We investigated audiovisual interactions driven by stimulus properties (bottom-up influences) or by task (top-down influences) on congruent and incongruent simultaneously presented faces and voices while ERPs were recorded. Subjects performed gender categorisation, directing attention either to faces or to voices and also judged whether the face/voice stimuli were congruent in terms of gender. Behaviourally, the unattended modality affected processing in the attended modality: the disruption was greater for attended voices. ERPs revealed top-down modulations of early brain processing (30-100 ms) over unisensory cortices. No effects were found on N170 or VPP, but from 180-230 ms larger right frontal activity was seen for incongruent than congruent stimuli.

Conclusions: Our data demonstrates that in a gender categorisation task the processing of faces dominate over the processing of voices. Brain activity showed different modulation by top-down and bottom-up information. Top-down influences modulated early brain activity whereas bottom-up interactions occurred relatively late.


Figures

Figure 1
Figure 1
Examples of face stimuli.
Figure 2
Figure 2
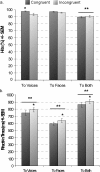
Behavioural measures. (a) Accuracy for the different tasks. (b) Reaction times. Responses to congruent stimuli are in dark and to incongruent stimuli in grey. Greater accuracy was seen for congruent than incongruent stimuli in the VOICE task; overall accuracy in the BOTH task was smaller compared to both FACE and VOICE tasks. Slower RTs were found to incongruent stimuli, regardless of attentional direction. RTs differed significantly across tasks. * p < 0.01; ** p < 0.001
Figure 3
Figure 3
Grand average ERPs for the three tasks. (a) ERPs at PO7 (left) and PO8 (right) for the congruent stimuli in each attentional task showing the typical P1 and N170 components to faces. (b) ERPs at FC1 (left) and FC2 (right) illustrating auditory N1, VPP and the shoulder (likely reflecting the auditory P2) for congruent stimuli in the different tasks. VOICE: solid black line, FACE: solid light grey line, BOTH: dashed dark grey line.
Figure 4
Figure 4
Results of the bootstrapped ANOVA for the 2 factors and their interaction. (a) Electrode locations. Red: electrodes on which visual components were measured. Green: electrodes on which auditory components were measured. (b) Results of the bootstrapped 2-way ANOVA. The scale represents F-values, when the 2-way ANOVA was significant after correction for repeated measures, for factor task and stimulus as well as the interaction. Non-significant F-values are presented in grey. Red rectangles indicate latencies of interest, determined by more consistent (spread over several electrodes and time points) and larger effects. This shows both early (30-90 ms) and later (170-220 ms) task effects, stimulus effects at 180-230 ms and no interaction.
Figure 5
Figure 5
Attention modulated early brain activity (30-90 ms). (a) Topography of the average F-values in this time range. Non-significant F-values are in grey. (b) Topography of the absolute differences between the two tasks where the p-values of the post-hoc test were significant (p < 0.05). Non-significant data are represented in grey. (c) Average topographic maps for each task between 30 and 90 ms. Left to right: FACE, VOICE, BOTH and the average between FACE and VOICE, shown as a comparison. Over posterior regions, the map for the BOTH task is similar to the map for the FACE task, while in fronto-central regions it is more similar to the map for VOICE. Comparison of BOTH with the average of VOICE and FACE shows that the topography in the BOTH task differed from the average topography of the other tasks over fronto-central electrodes.
Figure 6
Figure 6
Task and Stimulus effects between 150 and 250 ms. N170 (a) at PO9 and VPP (b) at C2 for the 6 conditions. In green: VOICE task, in red: FACE task, in black: BOTH task. Solid lines: congruent stimuli; dashed lines: incongruent stimuli. c) Effects of task between 170 and 220 ms; the two-way ANOVA was significant in frontal regions. Bottom: The maps represent the absolute differences between two conditions where post-hoc tests were significant. Non-significant data are represented in grey. d) Modulation of brain activity due to the stimuli between 180 ms and 230 ms for congruent and incongruent stimuli. Left map shows the significant F-values between 180 ms and 230 ms for the factor "stimulus" (non-significant F-values are represented in grey) and the right map shows the difference between topography to congruent and incongruent stimuli (scale: -1 1).

Similar articles

Cited by

References

    1. Giard MH, Peronnet F. Auditory-visual integration during multimodal object recognition in humans: a behavioral and electrophysiological study. Journal of Cognitive Neuroscience. 1999;11(5):473–490. doi: 10.1162/089892999563544. - DOI - PubMed
    1. Giard MH, Fort A, Mouchetant-Rostaing Y, Pernier J. Neurophysiological mechanisms of auditory selective attention in humans. Front Biosci. 2000;5:D84–94. doi: 10.2741/Giard. - DOI - PubMed
    1. Vroomen J, Driver J, de Gelder B. Is cross-modal integration of emotional expressions independent of attentional resources? Cogn Affect Behav Neuroscience. 2001;1(4):382–387. doi: 10.3758/CABN.1.4.382. - DOI - PubMed
    1. Bertelson P, Radeau M. Cross-modal bias and perceptual fusion with auditory-visual spatial discordance. Percept Psychophys. 1981;29(6):578–584. - PubMed
    1. Driver J. Enhancement of selective listening by illusory mislocation of speech sounds due to lip-reading. Nature. 1996;381(6577):66–68. doi: 10.1038/381066a0. - DOI - PubMed

Publication types

MeSH terms

LinkOut - more resources