. 2010;11(3):R29.
doi: 10.1186/gb-2010-11-3-r29. Epub 2010 Mar 11.

Genome-wide functional analysis of human 5' untranslated region introns

Affiliations

Genome-wide functional analysis of human 5' untranslated region introns

Can Cenik et al. Genome Biol. 2010.

Abstract

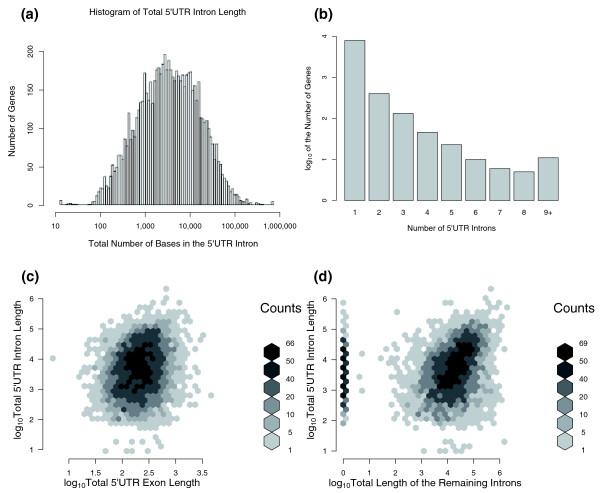
Background: Approximately 35% of human genes contain introns within the 5' untranslated region (UTR). Introns in 5'UTRs differ from those in coding regions and 3'UTRs with respect to nucleotide composition, length distribution and density. Despite their presumed impact on gene regulation, the evolution and possible functions of 5'UTR introns remain largely unexplored.

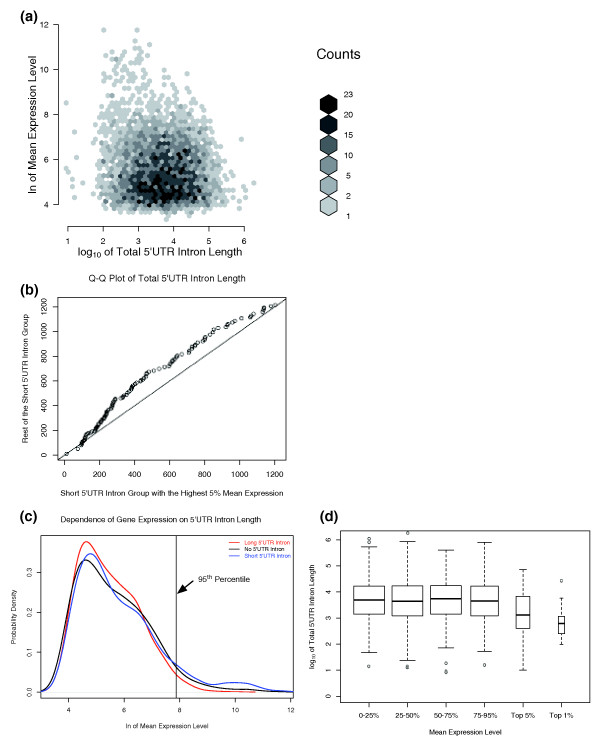
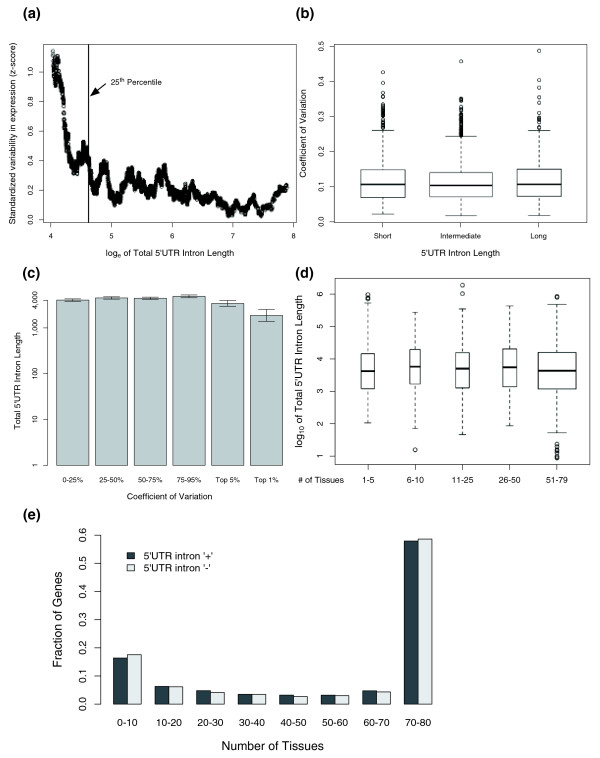
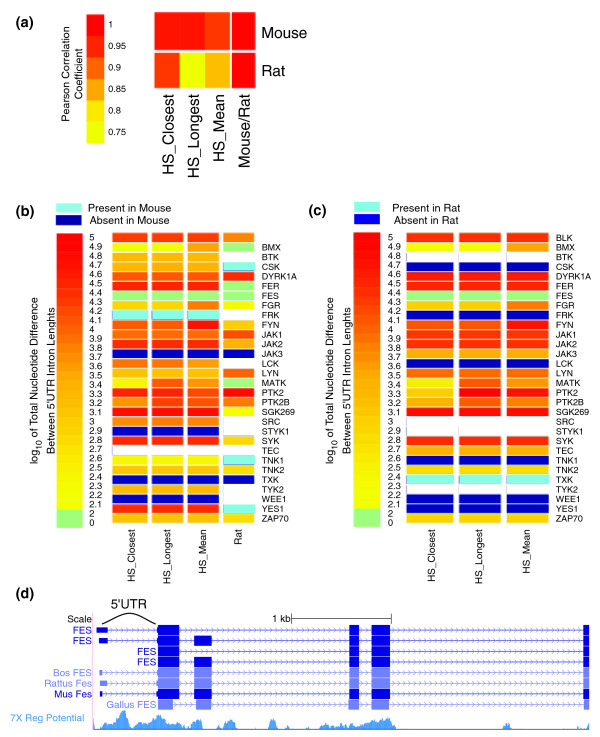
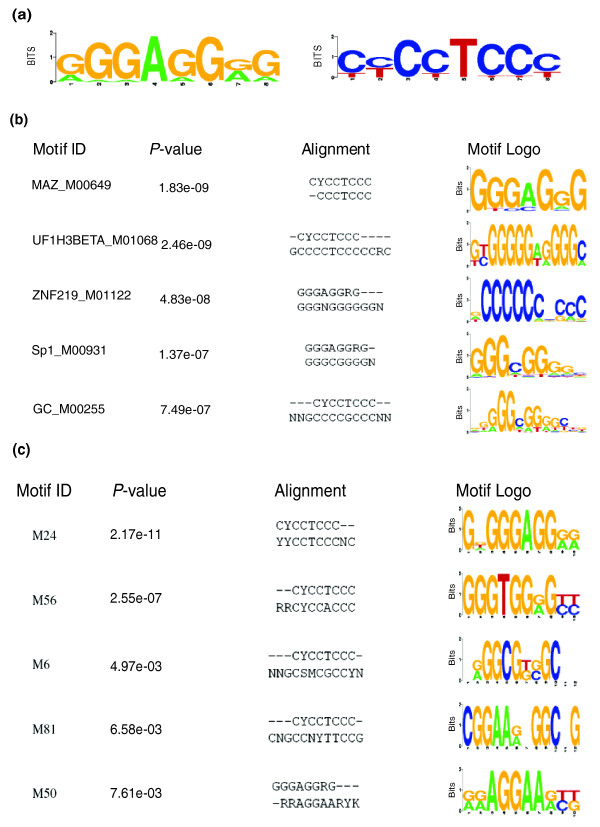
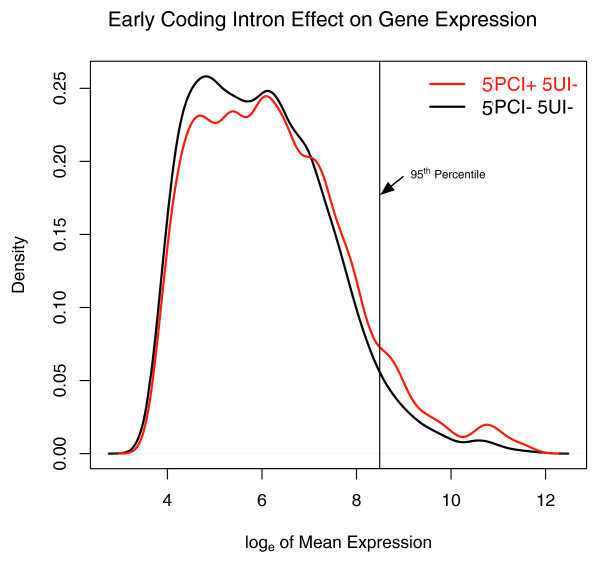
Results: We performed a genome-scale computational analysis of 5'UTR introns in humans. We discovered that the most highly expressed genes tended to have short 5'UTR introns rather than having long 5'UTR introns or lacking 5'UTR introns entirely. Although we found no correlation in 5'UTR intron presence or length with variance in expression across tissues, which might have indicated a broad role in expression-regulation, we observed an uneven distribution of 5'UTR introns amongst genes in specific functional categories. In particular, genes with regulatory roles were surprisingly enriched in having 5'UTR introns. Finally, we analyzed the evolution of 5'UTR introns in non-receptor protein tyrosine kinases (NRTK), and identified a conserved DNA motif enriched within the 5'UTR introns of human NRTKs.

Conclusions: Our results suggest that human 5'UTR introns enhance the expression of some genes in a length-dependent manner. While many 5'UTR introns are likely to be evolving neutrally, their relationship with gene expression and overrepresentation among regulatory genes, taken together, suggest that complex evolutionary forces are acting on this distinct class of introns.


Figures

Figure 1
Figure 1
Characterization of fundamental properties of 5'UTR introns. (a) Histogram of the total 5'UTR intron length. A well annotated set of RefSeq transcript IDs are used in this analysis and this histogram shows the distribution of the log10 of the total number of intronic nucleotides in the 5'UTR. (b) Distribution of the number of introns in the 5'UTR. The log10 of number of transcripts that have a given number of introns in their 5'UTR is shown. The number of transcripts with a given number of 5'UTR introns decreases exponentially. (c) Heat map depicting the relationship between total lengths of 5'UTR introns and 5'UTR exons. (d) Heat map depicting the relationship between total lengths of 5'UTR introns and non-5'UTR introns. In both heatmaps, darker shades of gray indicate more transcripts.
Figure 2
Figure 2
Expression analysis as a function of total 5'UTR intron length. (a) Heat map of the mean expression level versus the total 5'UTR intron length. The shade of gray represents the number of transcripts in each bin with darker shades implying more transcripts. The overrepresentation of short 5'UTR-intron-containing genes among the highest expression levels is apparent. (b) Quantile-quantile plot of total 5'UTR intron length of short 5'UTR intron-containing genes divided into highly expressed (top 5%) and other genes. The most highly expressed genes tend to have shorter 5'UTR introns. (c) Smoothed histogram of the mean expression level with respect to presence/absence of 5'UTR intron and its length. A kernel density estimator was fitted to the expression data and the corresponding probability density is plotted as a function of the mean expression level. The black line corresponds to the probability density for transcripts without any 5'UTR introns. Genes with long 5'UTR introns are represented by the red line while genes with short 5'UTR introns are represented by the blue line. The vertical line represents the top 5% of mean expression level of all genes. (d) Total 5'UTR intron length of genes in different expression level categories. The width of the boxes represents the relative number of data points in each category. Transcripts in the top 1% and top 5% in expression level tend to have shorter 5'UTR introns.
Figure 3
Figure 3
Analysis of variability in expression across tissues as a function of the total 5'UTR intron length. (a) Transcripts with low mean expression have higher normalized expression variability. A standardized measure of the variability in gene expression across tissues was calculated and plotted against the natural logarithm of mean expression level. The black vertical line represents the lowest 25th percentile in mean expression. Since transcripts with low levels of mean expression tend to exhibit an artificially high variability in expression, they are removed from further analysis. (b) Boxplot of the coefficient of variation (standard deviation-to-mean ratio) of genes grouped by the total length of 5'UTR intron. The width of the boxes represents the relative number of data points in each category. There are no apparent differences between the three groups (c) Boxplot of log10 of total 5'UTR intron length of genes grouped by their across-tissue variability. Genes are divided into six categories depending on their coefficient of variation. Error bars correspond to standard deviation of the mean. No obvious dependence of expression variability to total 5UI length can be observed except for the most highly variable genes, which tend to have slightly shorter 5'UTR introns. (d) Boxplot of log10 of total 5'UTR intron length for gene groups defined by the number of tissues in which expression of each gene was detected. A gene was defined to have detectable expression in a given tissues if its expression was higher than the 25th percentile of mean expression of all genes. We found no differences in total 5'UTR intron length amongst the different gene groups. (e) Histogram of number of genes divided by the presence of 5'UTR introns and by the number of tissues in which expression was detected. The number of tissues in which expression was detected was independent of the presence of 5'UTR introns.
Figure 4
Figure 4
Comparative genomics of 5'UTR introns within non-receptor tyrosine kinases. Several human NRTKs have multiple splice isoforms and for these we used three different methods for calculating total 5'UTR intron length: mean of 5'UTR intron length for isoforms with 5'UTR introns (HS_Mean); longest total 5'UTR intron length (HS_Longest); 5'UTR intron length most similar to its ortholog in the genome of interest (HS_Closest). (a) Heatmap of length correlation (considering genes with non-zero 5'UTR intron lengths) was plotted for the specified comparisons. As expected from the evolutionary distances between the analyzed species, the highest correlation (93%) was observed between mouse and rat NRTKs. (b) For each mouse ortholog of a human NRTK, the heatmap depicts the changes in total 5'UTR intron length (color reflects log10 of total 5'UTR intron length). The histogram above the color scale summarizes the distribution of changes in 5'UTR intron length. A 5'UTR intron may be present in mouse but not in the compared species (light blue) or vice versa (dark blue). Comparisons require an annotated 5'UTR for each ortholog, and were therefore not possible in some cases (white). (c) Same as (b) but substituting 'rat' for 'mouse'. (d) Human genomic region containing the 5'UTR and first few coding exons (UCSC Genome Browser view). '7X Regulatory Potential', for which higher scores indicate a greater potential for harboring regulatory sequence elements, was calculated using alignments of seven mammalian genomes as previously described [44].
Figure 5
Figure 5
Characterization of an 8-nucleotide DNA motif in the 5'UTR of human NRTKs. (a) Representative motif and its reverse complement. (b) Comparison of the representative motif to the TRANSFAC v11.3 database of known transcription factor binding sites. (c) Comparison of the representative motif to a list of conserved human predicted motifs [46]. STAMP website was used for the comparisons [47]. The default ungapped Smith-Waterman alignment was used and the P-value was calculated using the methods of Sandelin and Wasserman [74].
Figure 6
Figure 6
The effect of 5'-proximal coding intron presence on gene expression. (a) Smoothed histogram of the mean expression level with respect to presence/absence of 5'-proximal coding region introns (5PCIs). A kernel density estimator was fitted to the expression data and the corresponding probability density is plotted as a function of the mean expression level. The black line corresponds to the probability density for transcripts without any 5'UTR introns or any 5PCIs. The red line represents the probability density for 5'UTR intronless transcripts that have 5PCIs. The vertical line represents the top 5% of mean expression level of all genes without 5'UTR introns.

Similar articles

Cited by

References

    1. Rodriguez-Trelles F, Tarrio R, Ayala FJ. Origins and evolution of spliceosomal introns. Annu Rev Genet. 2006;40:47–76. doi: 10.1146/annurev.genet.40.110405.090625. - DOI - PubMed
    1. Roy SW, Gilbert W. The evolution of spliceosomal introns: patterns, puzzles and progress. Nat Rev Genet. 2006;7:211–221. - PubMed
    1. Rogozin IB, Wolf YI, Sorokin AV, Mirkin BG, Koonin EV. Remarkable interkingdom conservation of intron positions and massive, lineage-specific intron loss and gain in eukaryotic evolution. Curr Biol. 2003;13:1512–1517. doi: 10.1016/S0960-9822(03)00558-X. - DOI - PubMed
    1. Carmel L, Rogozin IB, Wolf YI, Koonin EV. Patterns of intron gain and conservation in eukaryotic genes. BMC Evol Biol. 2007;7:192. doi: 10.1186/1471-2148-7-192. - DOI - PMC - PubMed
    1. Lynch M, Conery JS. The origins of genome complexity. Science. 2003;302:1401–1404. doi: 10.1126/science.1089370. - DOI - PubMed

Publication types

Substances

LinkOut - more resources