. 2010 Mar 11:10:45.
doi: 10.1186/1471-2229-10-45.

The first set of EST resource for gene discovery and marker development in pigeonpea (Cajanus cajan L.)

Affiliations

The first set of EST resource for gene discovery and marker development in pigeonpea (Cajanus cajan L.)

Nikku L Raju et al. BMC Plant Biol. .

Abstract

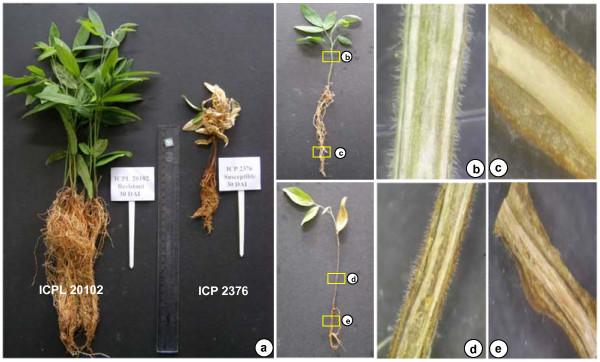
Background: Pigeonpea (Cajanus cajan (L.) Millsp) is one of the major grain legume crops of the tropics and subtropics, but biotic stresses [Fusarium wilt (FW), sterility mosaic disease (SMD), etc.] are serious challenges for sustainable crop production. Modern genomic tools such as molecular markers and candidate genes associated with resistance to these stresses offer the possibility of facilitating pigeonpea breeding for improving biotic stress resistance. Availability of limited genomic resources, however, is a serious bottleneck to undertake molecular breeding in pigeonpea to develop superior genotypes with enhanced resistance to above mentioned biotic stresses. With an objective of enhancing genomic resources in pigeonpea, this study reports generation and analysis of comprehensive resource of FW- and SMD- responsive expressed sequence tags (ESTs).

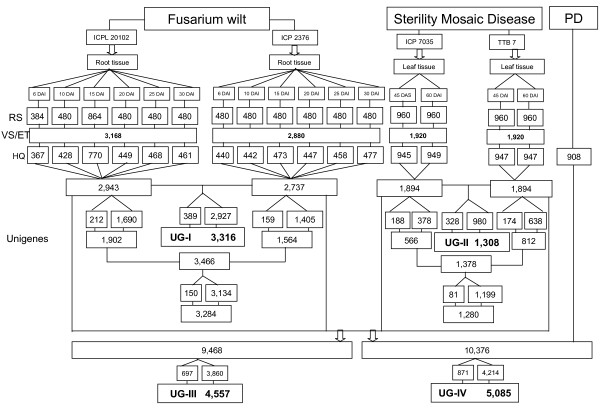
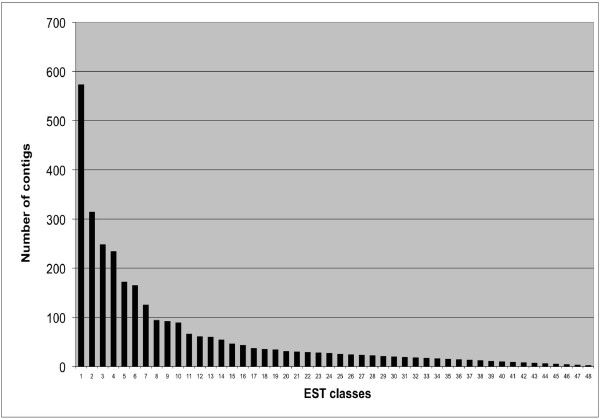
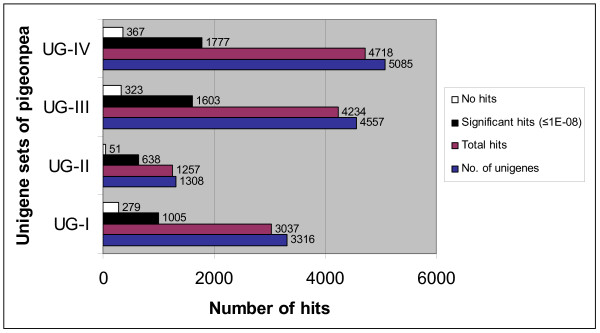
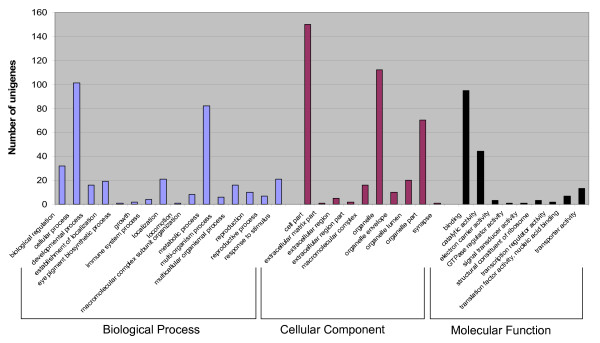
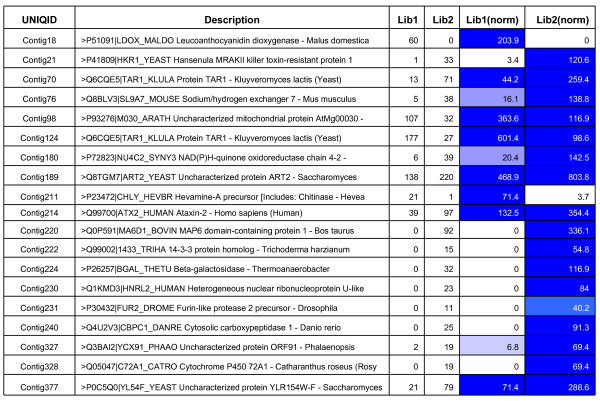
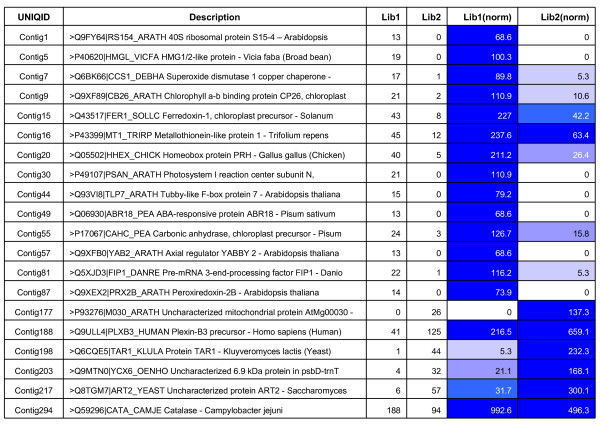
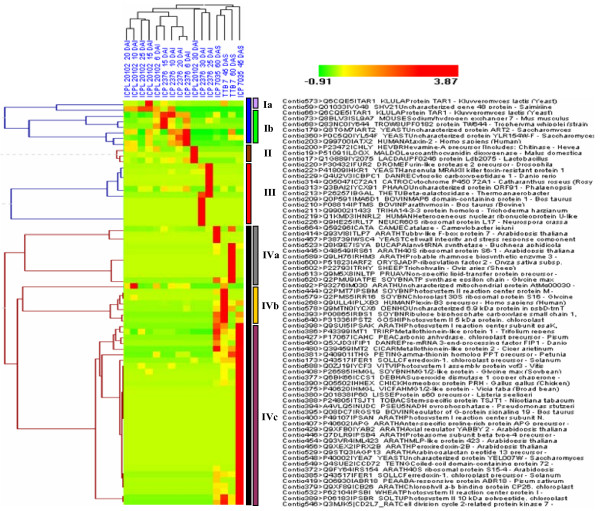
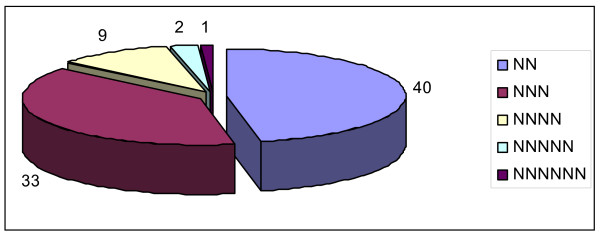
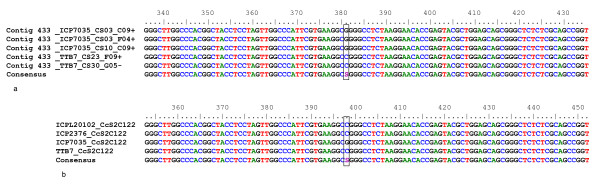
Results: A total of 16 cDNA libraries were constructed from four pigeonpea genotypes that are resistant and susceptible to FW ('ICPL 20102' and 'ICP 2376') and SMD ('ICP 7035' and 'TTB 7') and a total of 9,888 (9,468 high quality) ESTs were generated and deposited in dbEST of GenBank under accession numbers GR463974 to GR473857 and GR958228 to GR958231. Clustering and assembly analyses of these ESTs resulted into 4,557 unique sequences (unigenes) including 697 contigs and 3,860 singletons. BLASTN analysis of 4,557 unigenes showed a significant identity with ESTs of different legumes (23.2-60.3%), rice (28.3%), Arabidopsis (33.7%) and poplar (35.4%). As expected, pigeonpea ESTs are more closely related to soybean (60.3%) and cowpea ESTs (43.6%) than other plant ESTs. Similarly, BLASTX similarity results showed that only 1,603 (35.1%) out of 4,557 total unigenes correspond to known proteins in the UniProt database (<or= 1E-08). Functional categorization of the annotated unigenes sequences showed that 153 (3.3%) genes were assigned to cellular component category, 132 (2.8%) to biological process, and 132 (2.8%) in molecular function. Further, 19 genes were identified differentially expressed between FW- responsive genotypes and 20 between SMD- responsive genotypes. Generated ESTs were compiled together with 908 ESTs available in public domain, at the time of analysis, and a set of 5,085 unigenes were defined that were used for identification of molecular markers in pigeonpea. For instance, 3,583 simple sequence repeat (SSR) motifs were identified in 1,365 unigenes and 383 primer pairs were designed. Assessment of a set of 84 primer pairs on 40 elite pigeonpea lines showed polymorphism with 15 (28.8%) markers with an average of four alleles per marker and an average polymorphic information content (PIC) value of 0.40. Similarly, in silico mining of 133 contigs with >or= 5 sequences detected 102 single nucleotide polymorphisms (SNPs) in 37 contigs. As an example, a set of 10 contigs were used for confirming in silico predicted SNPs in a set of four genotypes using wet lab experiments. Occurrence of SNPs were confirmed for all the 6 contigs for which scorable and sequenceable amplicons were generated. PCR amplicons were not obtained in case of 4 contigs. Recognition sites for restriction enzymes were identified for 102 SNPs in 37 contigs that indicates possibility of assaying SNPs in 37 genes using cleaved amplified polymorphic sequences (CAPS) assay.

Conclusion: The pigeonpea EST dataset generated here provides a transcriptomic resource for gene discovery and development of functional markers associated with biotic stress resistance. Sequence analyses of this dataset have showed conservation of a considerable number of pigeonpea transcripts across legume and model plant species analysed as well as some putative pigeonpea specific genes. Validation of identified biotic stress responsive genes should provide candidate genes for allele mining as well as candidate markers for molecular breeding.


Figures

Figure 1
Figure 1
Fusarium wilt (FW) challenged pigeonpea seedlings at 30 days after inoculation (DAI). a) Fusarium wilt challenged pigeonpea genotypes ('ICPL 20102') and ('ICP 2376') at 30 days after inoculation (30 DAI); b & c) Microscopic examination of FW-resistant pigeonpea genotype ('ICPL 20102') showing no disease symptoms on shoot and root vascular tissues; d & e) Microscopic examination of FW-susceptible pigeonpea genotype ('ICP 2376') showing severe wilt symptoms on shoot and root vascular tissues.
Figure 2
Figure 2
Summary of total ESTs generated from FW- and SMD- responsive pigeonpea genotypes. Generation and analysis of ESTs from 16 cDNA libraries of pigeonpea subjected to Fusarium wilt (FW) and Sterility mosaic disease (SMD) stresses; (A) Clustering and assembly of 2,943 and 2,737 HQS (High quality sequences) derived from FW-responsive cDNA libraries of pigeonpea genotypes 'ICPL 20102' and 'ICP 2376', respectively resulted in 3,316 unigenes (UG-I); (B) Clustering and assembly of 1,894 HQS from each SMD-responsive pigeonpea genotypes 'ICP 7035' and 'TTB 7' resulted in 1,308 unigenes (UG-II); (C) 9,468 HQS generated from all the four genotypes in the study as shown in (A) and (B) were analyzed together that provided a set of 4,557 unigenes (UG-III); (D) Clustering analysis of generated ESTs in this study along with 908 public domain pigeonpea ESTs, which resulted in 5,085 unigenes (UG-IV), RS: Raw sequences; VS/ET: Vector trimmed/EST trimmed sequences; HQ: High quality sequences; PD: Public domain pigeonpea sequences from NCBI.
Figure 3
Figure 3
Frequency and distribution of pigeonpea ESTs among assembled contigs. Number of ESTs in EST classes (on X-axis) are as following: Class 1=2 , Class 2 = 3, Class 3 = 4, Class 4 = 5, Class 6 = 7, Class 7= 8, Class 8 = 9, Class 9 = 10, Class 10 = 11, Class 11 = 12, Class 12= 13, Class 13 = 14, Class 15 = 16, Class 16 = 17, Class 17 = 18, Class 18 = 19, Class 19 = 20, Class 20 = 21, Class 21 = 22, Class 22 = 23, Class 23 = 24, Class 24 = 25, Class 25 = 27, Class 26 = 28, Class 27 = 29, Class 28 = 30, Class 29 = 31, Class 30 = 34, Class 31 = 35, Class 32= 37, Class 33 = 43, Class 34 = 46, Class 35 = 54, Class 36 = 60, Class 37 = 61, Class 38 = 66, Class 39 = 89, Class 40 = 92, Class 41 = 94, Class 42 = 125, Class 43 = 165, Class 44 = 172, Class 45 = 234, Class 46= 248, Class 47 = 314 and Class 48 = 573.
Figure 4
Figure 4
BLASTX analysis of pigeonpea unigenes against UniProt database. BLASTX homology search was performed for all the four unigene datasets (UG-I, UG-II, UG-III and UG-IV) against the non-redundant UniProt database. The values against each bar represent total number of unigenes, total number of hits, significant hits at ≤ 1E-08 and no hits for each unigene set.
Figure 5
Figure 5
Gene Ontology (GO) assignment of pigeonpea unigenes (UG-III) by GO annotation. Functional categorization and distribution of 997 unigenes (UG-III) among three GO categories i.e biological process, cellular component and molecular function according to UniProt database.
Figure 6
Figure 6
Differential gene expression between FW- responsive genotypes using IDEG.6 web tool. Differentially expressed genes between libraries of FW-resistant ('ICPL 20102') and susceptible ('ICP 2376') genotypes. Cells with different degrees of blue color represent extent of gene expression.
Figure 7
Figure 7
Differential gene expression between SMD- responsive genotypes using IDEG.6 web tool. Differentially expressed genes between libraries of SMD resistant ('ICP 7035') and susceptible ('TTB 7') genotypes. Cells with different degrees of blue color represent extent of gene expression.
Figure 8
Figure 8
Hierarchical clustering analysis of differentially expressed genes from 16 libraries of pigeonpea using HCE version 2.0 beta web tool. Clusters of genes highly expressed in different libraries of pigeonpea genotypes subjected to FW and SMD stress. Columns represent different cDNA libraries and their relationship in a dendrogram. Clustering of highly expressed ESTs (normalized using R statistics, R>8) into four major clusters (indicated in vertical colour bars), and their cluster sub groups based on their library specificity. Colour scale represents the range of expression pattern by different genes with respect to libraries.
Figure 9
Figure 9
EST-SSR motifs derived from pigeonpea unigenes (UG-IV). Number of EST-SSR repeat motifs (excluding monomers) derived from unigenes (UG-IV) of pigeonpea cDNA libraries subjected to FW and SMD stress.
Figure 10
Figure 10
Dendrogram of elite pigeonpea accessions based on UPGMA analysis. Unweighted Pair Group Method using arithmetic average dendrogram showing relatedness among the forty elite pigeonpea genotypes representing 8 wild species and 32 cultivated genotypes. The scale at the bottom of the dendrogram indicates the level of similarity between the genotypes.
Figure 11
Figure 11
A snapshot of sequence alignment of EST sequences and amplicons for contig 433 validating the in silico predicted SNP. CAP3 alignment of ESTs (a) generated from 'ICP 7035' and 'TTB 7'in contig 433 showing a SNP between these genotypes and (b) Multiple sequence alignment of amplicon sequences generated from genomic DNA of four genotypes ('ICPL 20102', 'ICP 2376', 'ICP 7035' and 'TTB 7') with the primer pairs for the assembled contig 433. The in silico identified SNP in the EST contig 433 was confirmed in the amplicon sequences.

Similar articles

Cited by

References

    1. Varshney RK, Hoisington DA, Upadhyaya HD, Gaur PM, Nigam SN, Saxena KB, Vadez V, Sethy NK, Bhatia S, Aruna R, Channabyre Gowda MV, Singh NK. In: Genomic-Assisted crop improvement. Varshney RK, Tuberosa R, editor. Springer Netherlands, The Netherlands; 2007. Molecular genetics and breeding of grain legume crops for the semi-arid tropics; pp. 207–241. full_text.
    1. Greilhuber J, Obermayer R. Genome size variation in Cajanus cajan (Fabaceae): a reconsideration. Plant Syst Evol. 1998;212:135–141. doi: 10.1007/BF00985225. - DOI
    1. FAOSTAT 2006. http://faostat.fao.org
    1. Rao SC, Coleman SW, Mayeux HS. Forage production and nutritive value of selected pigeonpea ecotypes in the southern great plains. Crop Sci. 2002;42:1259–1263.
    1. Prasad P, Eswara Reddy NP, Anandam RJ, Lakshmikantha Reddy G. Isozymes variability among Fusarium udum resistant cultivars of pigeonpea (Cajanus cajan (L.) (Millsp) Acta Physiol Plant. 2003;25:221–228. doi: 10.1007/s11738-003-0001-8. - DOI

Publication types

Substances

LinkOut - more resources