. 2010 Mar 11;65(5):597-611.
doi: 10.1016/j.neuron.2010.01.027.

Dicer1 and miR-219 Are required for normal oligodendrocyte differentiation and myelination

Affiliations

Dicer1 and miR-219 Are required for normal oligodendrocyte differentiation and myelination

Jason C Dugas et al. Neuron. .

Abstract

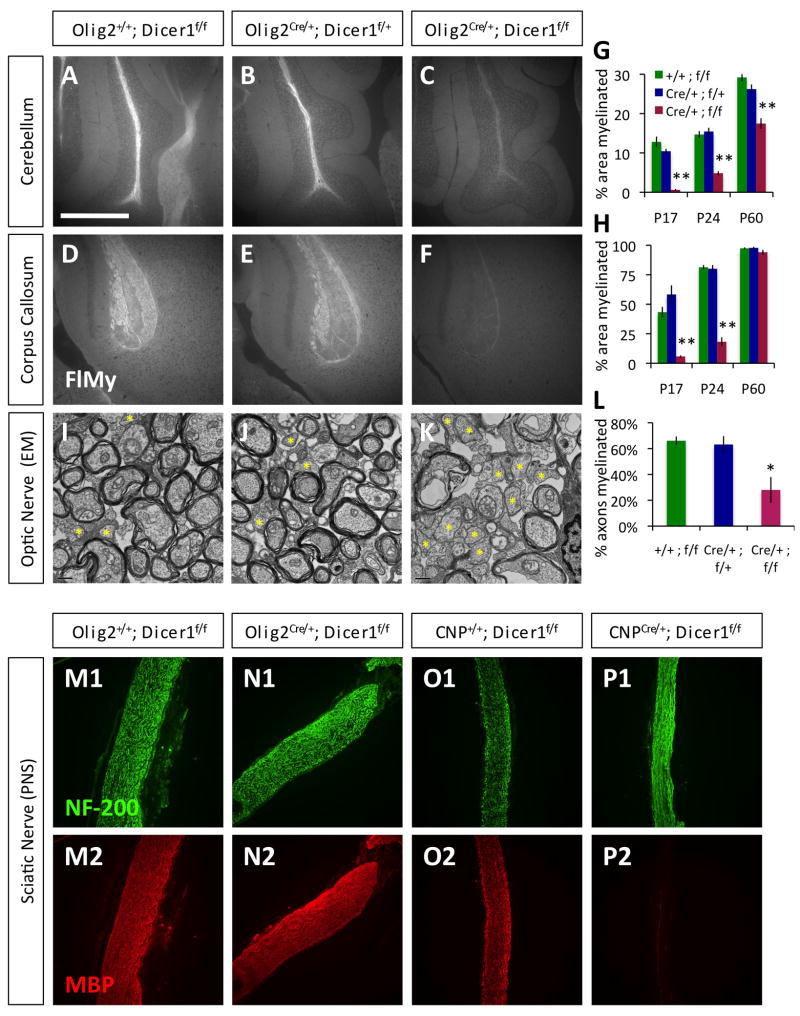
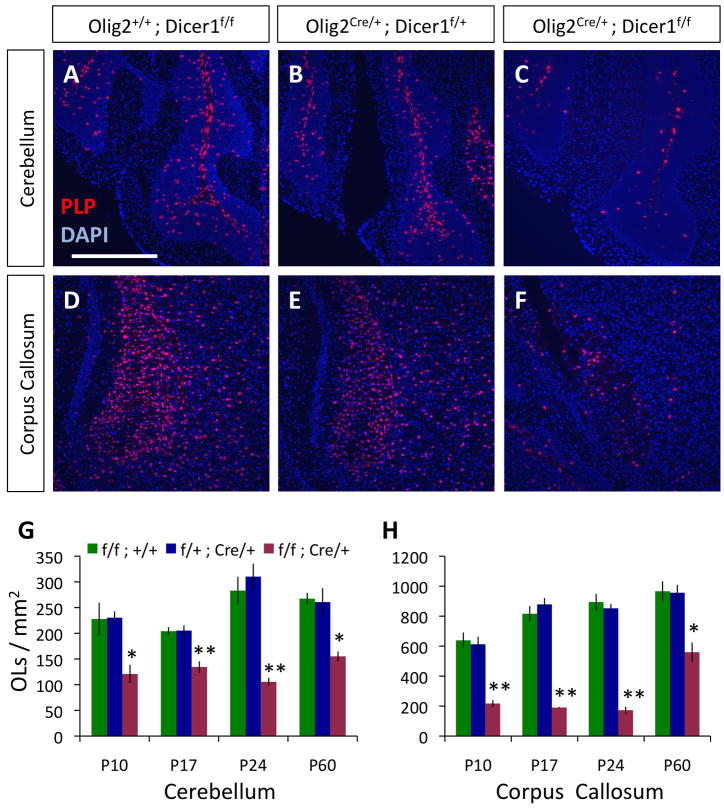
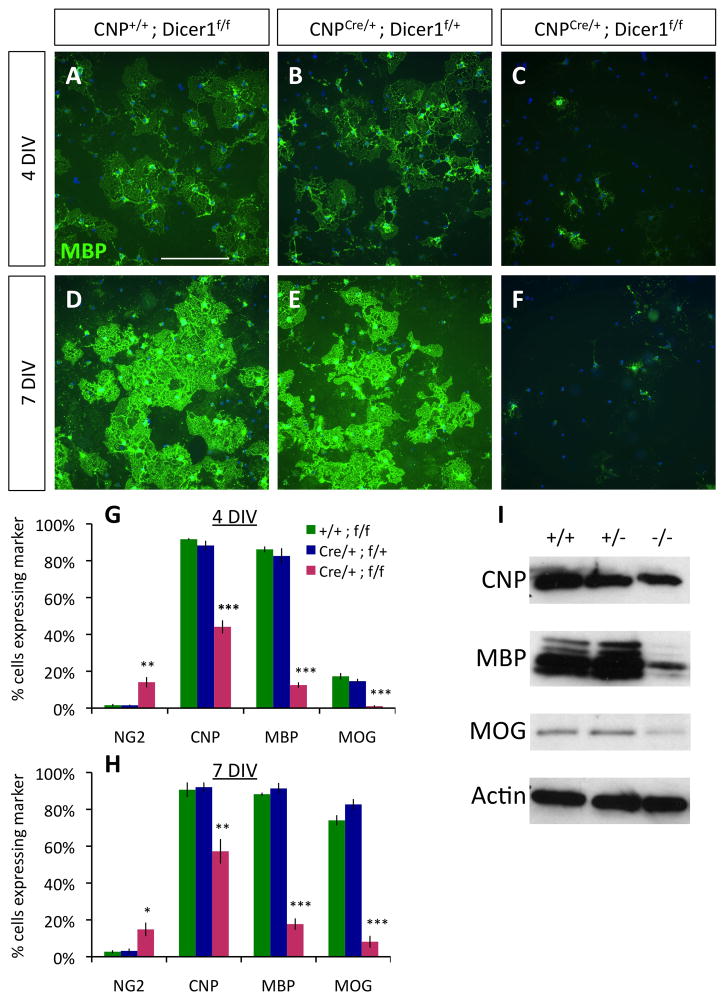
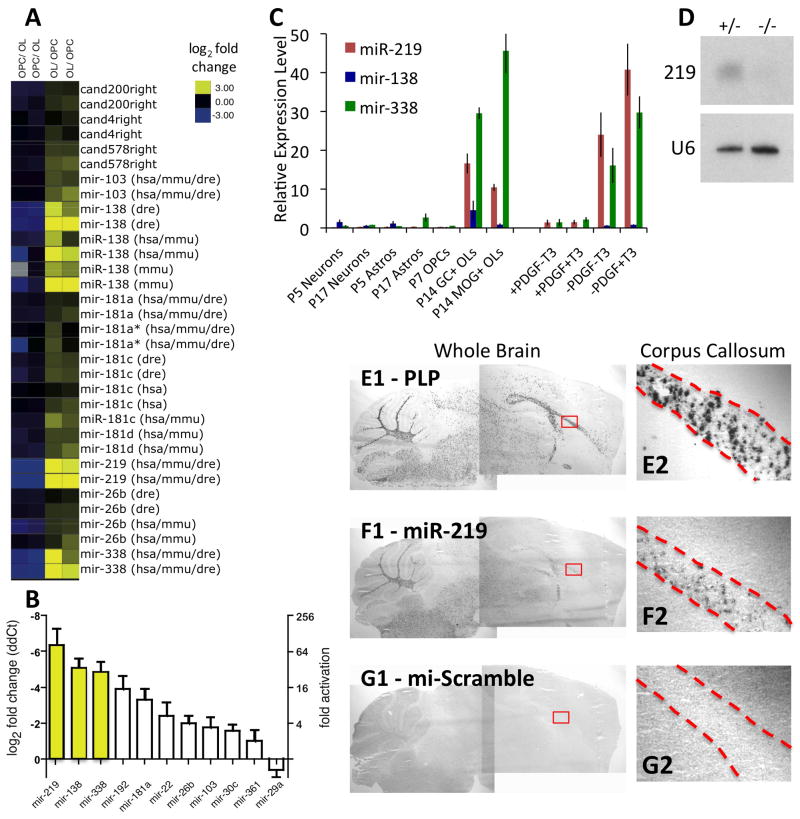
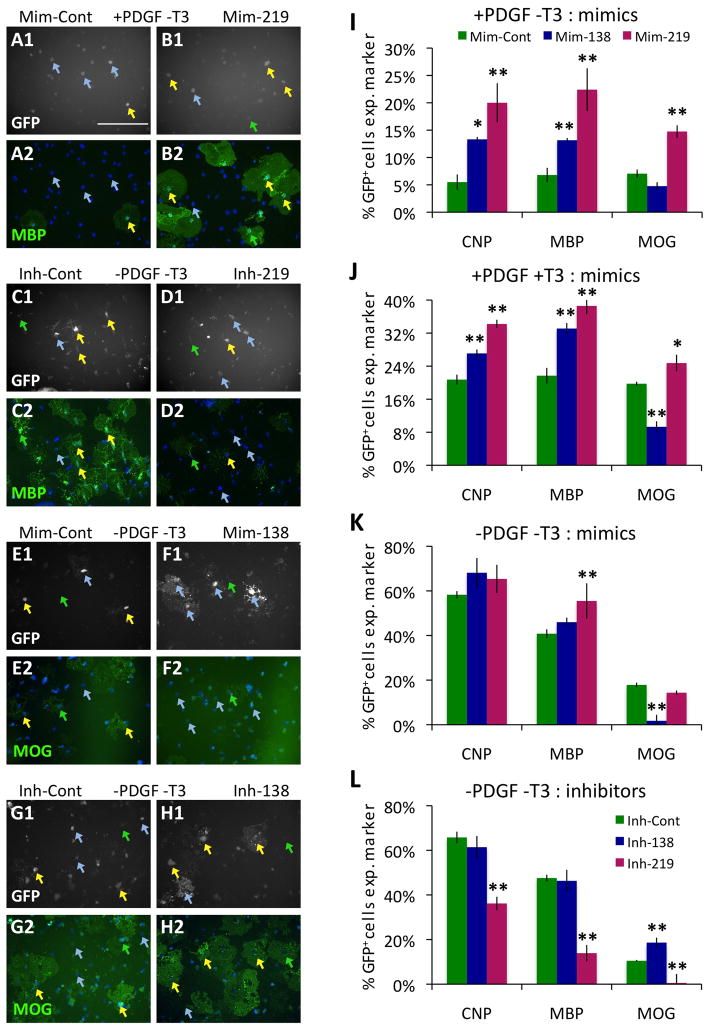
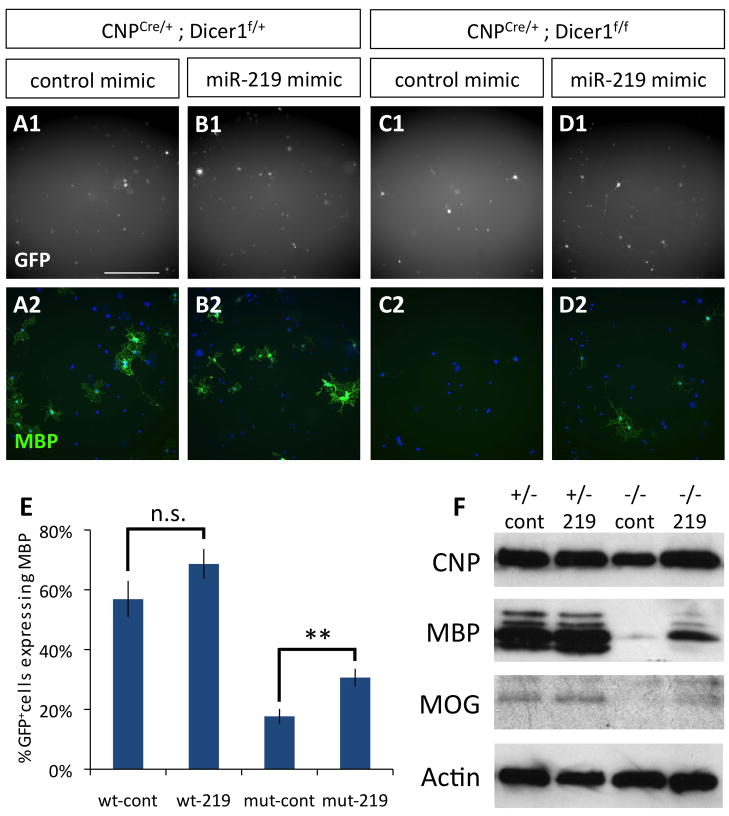
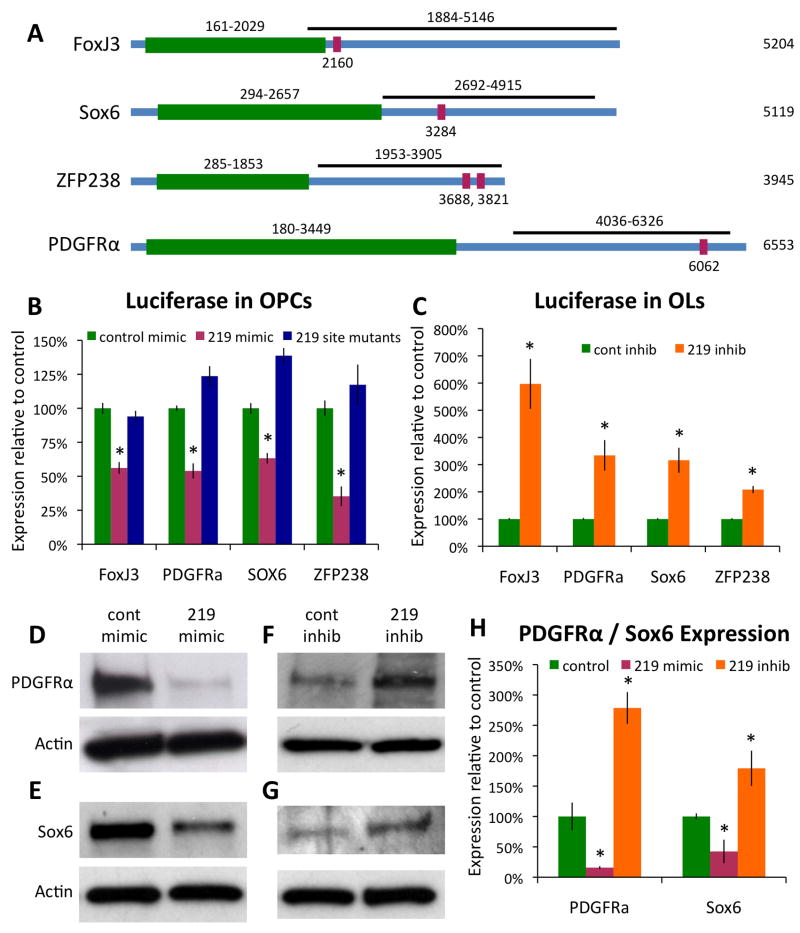
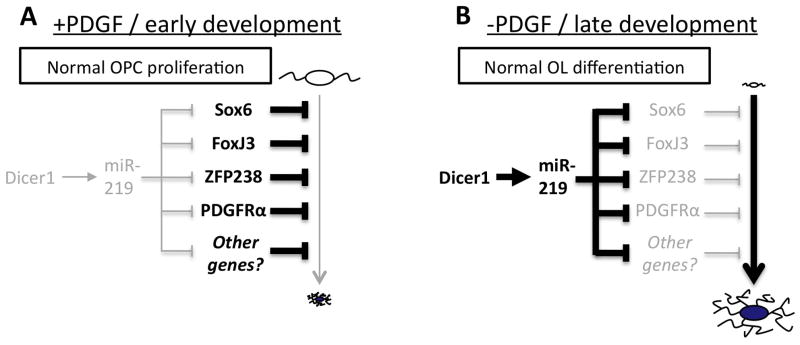
To investigate the role of microRNAs in regulating oligodendrocyte (OL) differentiation and myelination, we utilized transgenic mice in which microRNA processing was disrupted in OL precursor cells (OPCs) and OLs by targeted deletion of Dicer1. We found that inhibition of OPC-OL miRNA processing disrupts normal CNS myelination and that OPCs lacking mature miRNAs fail to differentiate normally in vitro. We identified three miRNAs (miR-219, miR-138, and miR-338) that are induced 10-100x during OL differentiation; the most strongly induced of these, miR-219, is necessary and sufficient to promote OL differentiation, and partially rescues OL differentiation defects caused by total miRNA loss. miR-219 directly represses the expression of PDGFRalpha, Sox6, FoxJ3, and ZFP238 proteins, all of which normally help to promote OPC proliferation. Together, these findings show that miR-219 plays a critical role in coupling differentiation to proliferation arrest in the OL lineage, enabling the rapid transition from proliferating OPCs to myelinating OLs.


Figures

Figure 1
Figure 1. Disruption of Dicer1 in myelinating cells disrupts normal myelin formation
AF. Visualization of compact CNS myelin by FluoroMyelin (FlMy) staining in the cerebellar arms (A–C) and splenium regions of the corpus callosum (D–F) from similar depth sagital brain sections from P24 littermate control Olig2+/+;Dicer1f/f (A,D), Olig2Cre/+;Dicer1f/+ (B,E), and mutant Olig2Cre/+;Dicer1f/f (C,F) mice. Scale bar = 500μm. GH. Percentage area myelinated, as determined by FlMy staining, in the cerebellar arms (G) and corpora callosa (H) of mutant Olig2Cre/+;Dicer1f/f and littermate control mice at P17–18, P23–24, and P60. IK. EM of optic nerve cross sections collected from P24 littermate control Olig2+/+;Dicer1f/f (I), Olig2Cre/+;Dicer1f/+ (J), and mutant Olig2Cre/+;Dicer1f/f (K) mice. Yellow asterisks = example unmyelinated axons. Scale bar = 0.5μm. L. Percentages of axons myelinated in the optic nerves of P23–24 mutant Olig2Cre/+;Dicer1f/f and littermate control mice. MP. Sciatic nerve longitudinal sections from P23 littermate control Olig2+/+;Dicer1f/f (M) and mutant Olig2Cre/+;Dicer1f/f (N) mice, P22 littermate control CNP+/+;Dicer1f/f (O) and mutant CNPCre/+;Dicer1f/f (P) mice stained for axons (NF-200, M1–P1) and myelin (MBP, M2–P2). Error bars ±S.E.M., n=3–5 animals/condition. * p < 0.05, ** p < 0.001 post-hoc all pairwise SNK tests, mutant compared to either control condition. See also Fig. S1–S2, Movie S1–S2.
Figure 2
Figure 2. Mature OL numbers are reduced in mice lacking Dicer1 function in OPCs and OLs
AF. In situs for PLP expression (red) to visualize mature OLs in the cerebellar arms (A–C) and corpus callosum (D–F) in P24 littermate control Olig2+/+;Dicer1f/f (A,D), Olig2Cre/+;Dicer1f/+ (B,E), and mutant Olig2Cre/+;Dicer1f/f (C,F) mice. Scale bar = 500μm. G–H. Quantification of mature OLs/mm2 in the cerebellar arms (G) and corpora callosa (H) of mutant Olig2Cre/+;Dicer1f/f and littermate control mice at P10, 17, 24, and 60. Error bars ±S.E.M., n=3 animals/condition. * p < 0.01, ** p < 0.001 post-hoc Holm-Sidak/SNK tests, mutant compared to either control condition. See also Fig. S3.
Figure 3
Figure 3. Purified OPCs lacking Dicer1 fail to differentiate normally
A–F. OPCs purified from P7 control CNP+/+;Dicer1f/f (A,D), CNPCre/+;Dicer1f/+ (B,E), and mutant CNPCre/+;Dicer1f/f mice (C,F), cultured for 4 DIV (AC) or 7 DIV (DF) in −PDGF−T3 media, then stained for MBP expression (green); nuclei stained by DAPI (blue). Scale bar = 200μm. G–H. Percentages of cultured cells expressing the indicated markers (NG2, CNP, MBP, or MOG) at 4 DIV (G) or 7 DIV (H). Error bars ±S.E.M., n=3 samples/condition. * p < 0.05, ** p < 0.005, *** p < 0.001 post-hoc all pairwise SNK tests, mutant compared to either control condition. I. Western blots showing reduced expression of CNP, MBP, and MOG in mutant CNPCre/+;Dicer1f/f (−/−) OLs relative to control CNP+/+;Dicer1f/f (+/+) and CNPCre/+;Dicer1f/+ (+/−) OLs; protein from purified OPCs cultured 4 DIV in −PDGF−T3 media. Actin blot shown is stripped and re-probed MBP blot. See also Fig. S4.
Figure 4
Figure 4. miR-219, -138, and -338 are most highly expressed by OLs in the CNS and are induced specifically by mitogen withdrawal
A. miRNA expression was compared between OPCs and OLs. Averaged results from 4x two-color microarrays are shown. “Cand” = candidate miRNAs at the time of microarray printing. Hsa, mmu, and dre = human, mouse, and zebrafish annotated miRNAs. B. qRT-PCR to determine relative OL/OPC expression level of individual miRNAs. Error bars ±S.E.M.; n=3 samples, 4x independent qRT-PCR runs per sample. C. qRT-PCR to determine expression levels of miR-219, -138, and -338 in acutely purified P5 or P17 neurons and astrocytes, P7 OPCs, P14 GC+ MOG immature OLs, and P14 MOG+ mature OLs (left), or in OPCs cultured for 7 DIV in indicated media: ±PDGF±T3 (right). Error bars ±S.E.M., n=2–8 samples. D. Northern blot showing mature miR-219 expression in acutely purified P23 Olig2Cre/+;Dicer1f/+ OLs (+/−), which is strongly reduced in Olig2Cre/+;Dicer1f/f OLs (−/−). Blots were stripped and re-probed for U6 snRNA as loading control. E–G. In situ hybridizations showing expression of PLP (E) and miR-219 (F) in sagital sections of a wt P17 mouse brain, compared to short LNA negative control probe (G). Boxed regions in E1–G1 shown at higher magnification in E2–G2, corpus callosum outlined by dashed lines. See also Fig. S5, Table S1.
Figure 5
Figure 5. miR-219 and -138 regulate normal OL differentiation
A–H. Transfected OPCs identified by GFP expression (white, A1–H1) that express indicated markers (green, MBP: A2–D2; MOG: E2–H2) are indicated by yellow arrows; transfected GFP+ cells negative for marker expression are indicated by blue arrows; untransfected GFP cells positive for marker expression are indicated by green arrows. Nuclei marked by DAPI (blue, A2–H2). Scale bar = 200 μm. A–B. OPCs transfected with control mimic (A) or miR-219 mimic (B) cultured for 7 DIV in +PDGF−T3 media. C–D. OPCs transfected with control inhibitor (C) or miR-219 inhibitor (D) cultured for 3 DIV in −PDGF−T3 media. E–F. OPCs transfected with control mimic (E) or miR-138 mimic (F) cultured for 4 DIV in −PDGF−T3 media. G–H. OPCs transfected with control inhibitor (G) or miR-138 inhibitor (H) cultured for 4 DIV in −PDGF−T3 media. I–L. Percentages of transfected, GFP+ cells expressing the indicated markers (CNP, MBP, or MOG). OPCs transfected with control, miR-138, and miR-219 mimics (IK) or control, miR-138, and miR-219 inhibitors (L). Transfected cells cultured for 7 DIV in +PDGF−T3 (I) or +PDGF+T3 (J) media, or 3–4 DIV in −PDGF−T3 (KL) media. Error bars ±S.E.M., n=3 (IJ); n=9 (K), n=6 (L). * p < 0.05, ** p < 0.01 post-hoc Holm-Sidak test vs. control. See also Fig. S6.
Figure 6
Figure 6. miR-219 partially rescues OL differentiation in Dicer OPCs
A–D. Transfected OPCs (GFP+ = white, A1–D1), stained for MBP expression (green) and co-stained with DAPI (blue, A2–D2). OPCs purified from P7 control littermate CNPCre/+;Dicer1f/+ (AB) and mutant CNPCre/+;Dicer1f/f mice (CD) were transfected with control mimic (A,C) or miR-219 mimic (B,D) and cultured 4 DIV in −PDGF−T3 media. Scale bar = 200 μm. E. Percentages of healthy control (cont) or miR-219 (219) mimic transfected CNPCre/+;Dicer1f/+ (wt) and mutant CNPCre/+;Dicer1f/f (mut) OLs expressing MBP. Error bars ±S.E.M., n=9. ** p < 0.005, n.s. = not significant T-test control vs. miR-219 transfections. F. Western blots to determine CNP, MBP, and MOG expression levels in control CNPCre/+;Dicer1f/+ (+/−) and mutant CNPCre/+;Dicer1f/f (−/−) OPCs transfected with miR-219 or control mimic miRNA and cultured 4 DIV in −PDGF−T3 media. Actin blot shown is stripped and re-probed MBP blot. See also Fig. S7, Table S2–S4.
Figure 7
Figure 7. miR-219 represses the expression of PDGFRα, Sox6, FoxJ3, and ZFP238
A. Regions of the FoxJ3, Sox6, ZFP238, and PDGFRα 3′ UTRs cloned into the luciferase reporter construct are depicted (black bars). Green = coding regions of depicted genes, red = locations of predicted miR-219 targeted sites. B. Luciferase activity at 1–2 DIV in OPCs co-transfected with indicated luciferase reporter constructs and either control (green) or miR-219 (red) mimic, blue = co-transfections of miR-219 mimic with reporter constructs containing mutated 219 binding sites; data normalized to control mimic co-transfection luciferase activity. C. Luciferase activity at 4 DIV in OLs co-transfected with indicated luciferase reporter constructs and either control (green) or miR-219 (orange) inhibitor. D–G. Western blot showing the levels of PDGFRα (D,F) or Sox6 (E,G) expression in OPCs transfected with control or miR-219 mimic, 2 DIV +PDGF−T3 (D,E), or transfected with control or miR-219 inhibitor, 1–3 DIV −PDGF+T3 (F,G). All blots stripped and re-probed for actin as loading control. H. Actin-normalized PDGFRα and Sox6 expression, relative to control transfection levels, in OPCs transfected with miR-219 mimic (red) or inhibitor (orange). Error bars ±S.E.M., n = 8–12 (BC) or 3–4 (H). * p < 0.001 (BC) or < 0.05 (H) T-test control vs. miR-219 mimic/inhibitor transfections (T-tests 219 site mutants vs. control not done). See also Fig. S8.
Figure 8
Figure 8. Model of Dicer1 and miR-219 promotion of OL differentiation
Arrows indicate a promotion of pathway or expression, and bars indicate inhibition of pathway or expression. Stronger activity/expression is denoted by bold lines/text, and weaker activity/expression is denoted by grey lines/text. A. OL differentiation is inhibited by several OPC-expressed genes in the presence of large amounts of PDGF/early development under normal conditions. B. When mitogens become limiting, Dicer1 and miR-219 expression is induced, leading to a direct, accelerated repression of several OPC-expressed genes and a de-repression of OL differentiation. See text for additional details.

Comment in

Similar articles

Cited by

References

    1. Aoki K, Meng G, Suzuki K, Takashi T, Kameoka Y, Nakahara K, Ishida R, Kasai M. RP58 associates with condensed chromatin and mediates a sequence-specific transcriptional repression. J Biol Chem. 1998;273:26698–26704. - PubMed
    1. Assanah M, Lochhead R, Ogden A, Bruce J, Goldman J, Canoll P. Glial progenitors in adult white matter are driven to form malignant gliomas by platelet-derived growth factor-expressing retroviruses. J Neurosci. 2006;26:6781–6790. - PMC - PubMed
    1. Assanah MC, Bruce JN, Suzuki SO, Chen A, Goldman JE, Canoll P. PDGF stimulates the massive expansion of glial progenitors in the neonatal forebrain. Glia 2009 - PubMed
    1. Barres BA, Lazar MA, Raff MC. A novel role for thyroid hormone, glucocorticoids and retinoic acid in timing oligodendrocyte development. Development. 1994a;120:1097–1108. - PubMed
    1. Barres BA, Raff MC. Control of oligodendrocyte number in the developing rat optic nerve. Neuron. 1994;12:935–942. - PubMed

Publication types

MeSH terms

Substances