. 2010 Mar 11;65(5):718-31.
doi: 10.1016/j.neuron.2010.02.019.

Monaural deprivation disrupts development of binaural selectivity in auditory midbrain and cortex

Affiliations

Monaural deprivation disrupts development of binaural selectivity in auditory midbrain and cortex

Maria V Popescu et al. Neuron. .

Abstract

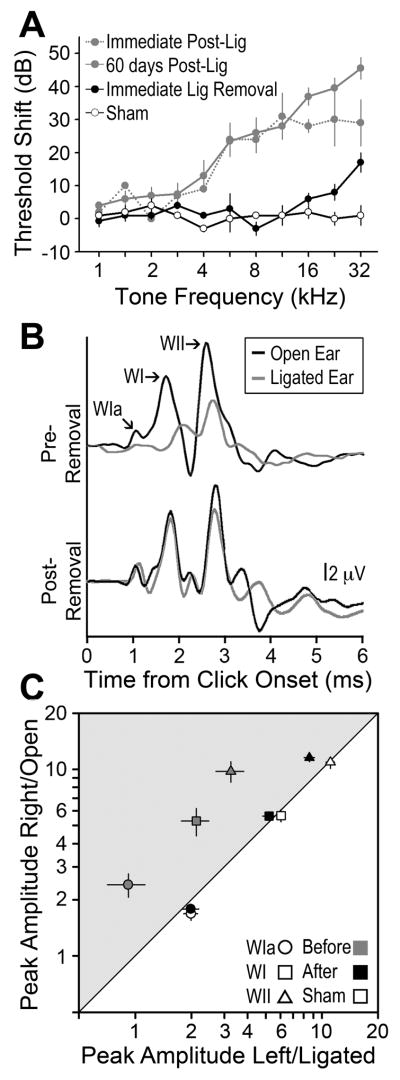
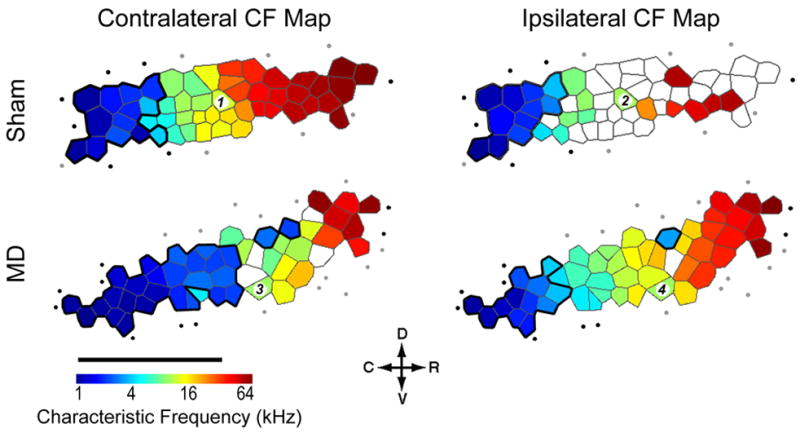
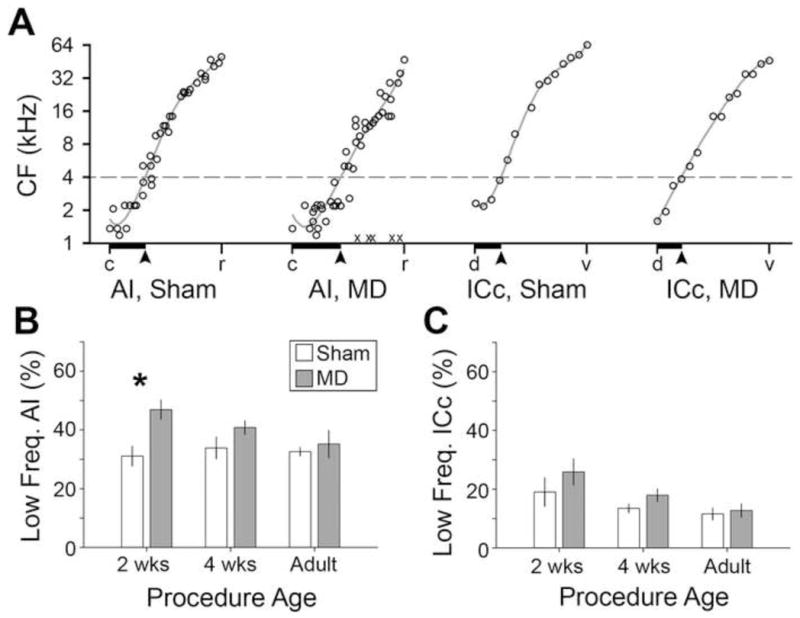
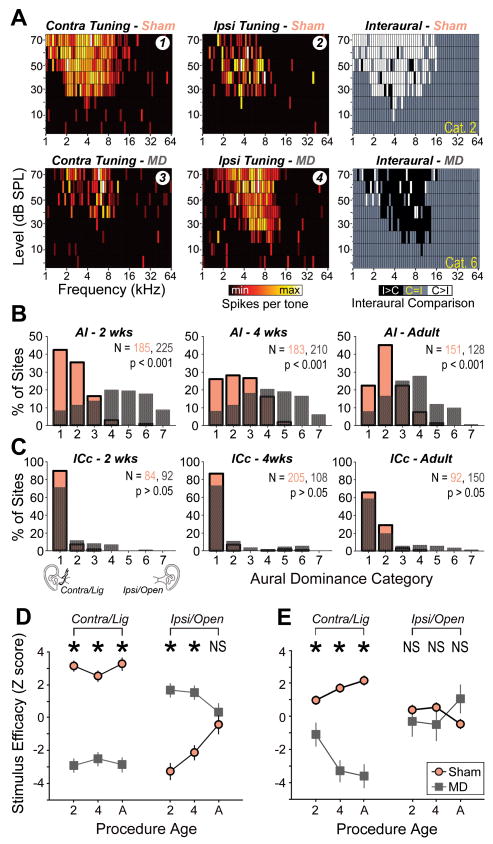
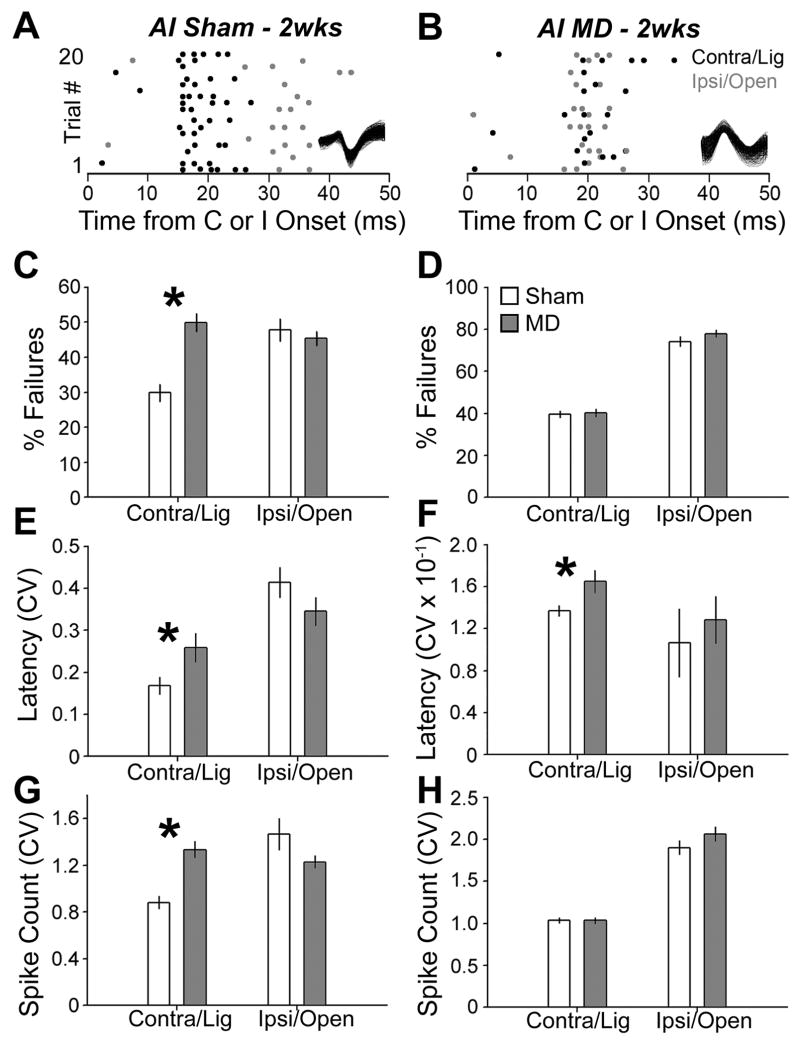
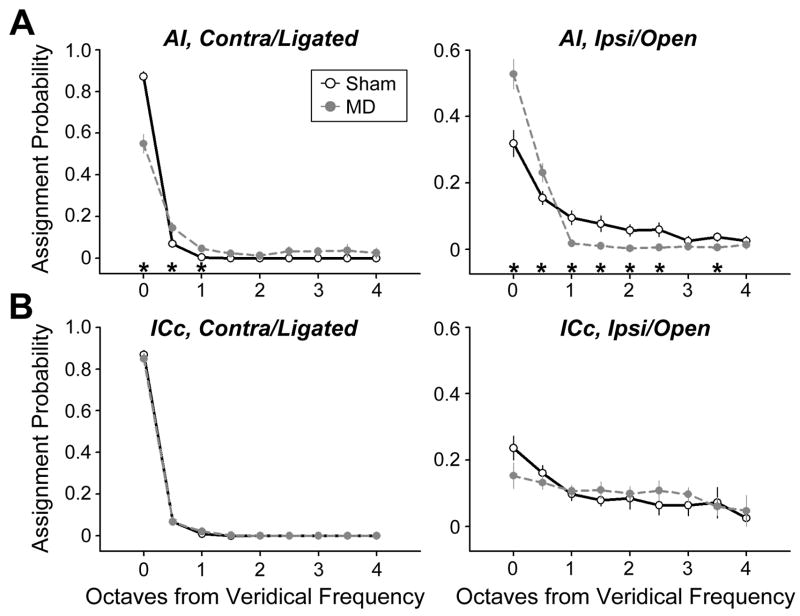
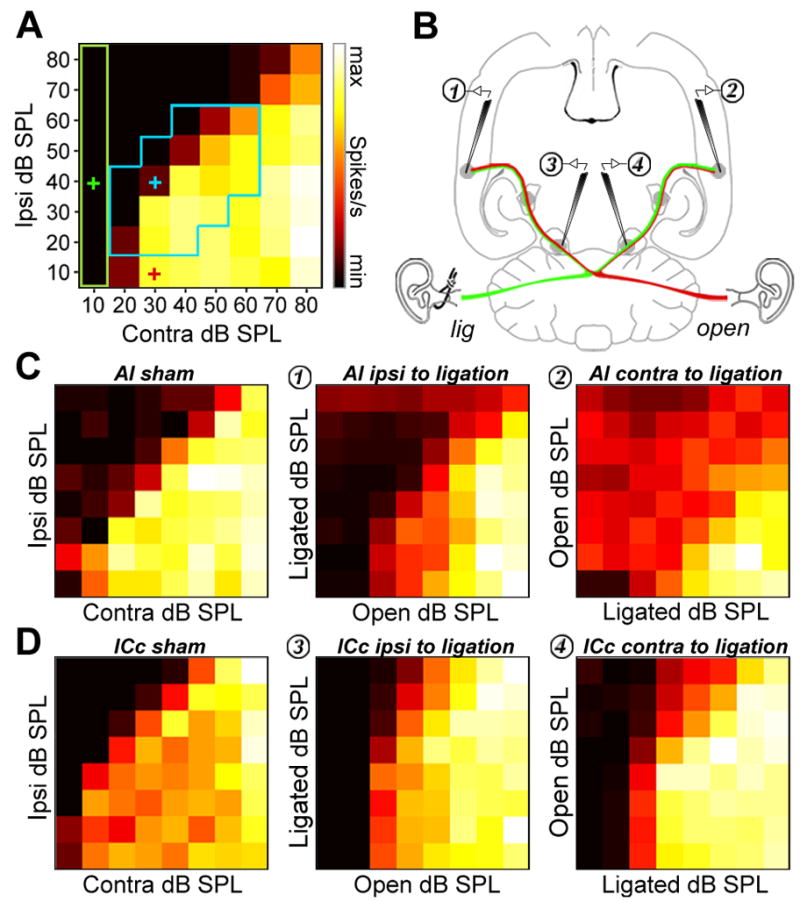
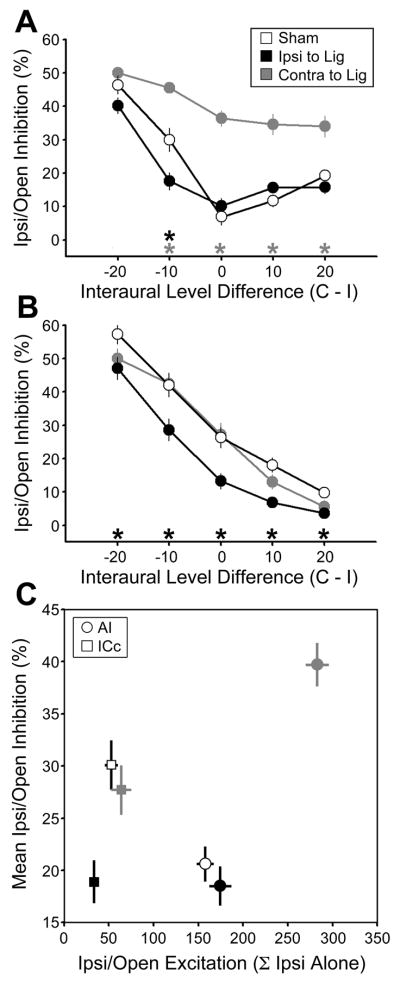
Degraded sensory experience during critical periods of development can have adverse effects on brain function. In the auditory system, conductive hearing loss associated with childhood ear infections can produce long-lasting deficits in auditory perceptual acuity, much like amblyopia in the visual system. Here we explore the neural mechanisms that may underlie "amblyaudio" by inducing reversible monaural deprivation (MD) in infant, juvenile, and adult rats. MD distorted tonotopic maps, weakened the deprived ear's representation, strengthened the open ear's representation, and disrupted binaural integration of interaural level differences (ILD). Bidirectional plasticity effects were strictly governed by critical periods, were more strongly expressed in primary auditory cortex than inferior colliculus, and directly impacted neural coding accuracy. These findings highlight a remarkable degree of competitive plasticity between aural representations and suggest that the enduring perceptual sequelae of childhood hearing loss might be traced to maladaptive plasticity during critical periods of auditory cortex development.


Figures

Figure 1
Figure 1. Reversible, stable and low-pass CHL
ABR measurements were made either in a free field (gray data points) or closed field (black and open data points) based on tone burst response threshold (A) or click-evoked response amplitudes (B an C). In all cases, comparisons are made between ligated vs. open ear (MD) or right vs. left ear (sham). (A) Threshold differences are calculated as (ligated – open) or (right – left) for MD and sham rats, respectively. (B) Waves Ia, I and II are identified from the composite ABR waveforms evoked by an 80 dB SPL click. (C) Mean amplitudes of waves Ia (circles), I (squares) and II (triangles) are compared between the ligated vs. open (MD) or left vs. right ears (sham) with the ligation in place (gray), following ligation removal (black) or in sham rats (open). Points in the gray shaded region reflect hearing loss.
Figure 2
Figure 2. Reorganization of contralateral and ipsilateral CF maps following MD in early life
Representative CF maps derived from stimuli presented to the contralateral/ligated (left column) and ipsilateral/open (right column) ear in a sham (top row) and MD (bottom row) rat. Tonotopy is represented using a Voronoi tessellation, in which each polygon represents a single electrode penetration, the color of each polygon represents the CF for that site and the area of the polygon is proportional to the spacing between electrode penetrations. Recording sites with CFs < 4 kHz are enclosed with a bold black line to highlight sound frequencies that can more readily pass through the ear canal ligation. Unfilled polygons represent sites that were not responsive or poorly tuned to either contralateral or ipsilateral inputs. Filled circles = non-AI recording site, open circles = recording site unresponsive to either ear, D = dorsal, C = caudal, R = rostral, V = ventral, scale bar = 1 mm. Recording sites 1–4 yielded the FRAs shown in Fig 4.
Figure 3
Figure 3. A critical period for tonotopic map distortion
(A) CFs are plotted according to their normalized position along the tonotopic axis of AI or ICc maps and fit with a polynomial function (solid line). The point at which CF fit function crosses 4 kHz (broken line) is matched up with the tonotopic position at that point (solid arrow) and the cumulative percentage is defined as the low frequency map area (solid horizontal bars). (B an C) Mean low frequency map areas in AI (B) and ICc (C) in MD- (open bars) or sham-operated rats (shaded bars) are shown according to the age when the procedure was performed. Asterisk denotes significant difference with an unpaired t-test (p < 0.05). c = caudal, r = rostral, d = dorsal, v = ventral.
Figure 4
Figure 4. Bi-directional changes in contralateral and ipsilateral input efficacy underlie reorganization of aural dominance
(A) FRAs derived from tones presented to the contralateral (left column) and ipsilateral (middle column) ears from a single sham (top row) and MD (bottom row) recording site from the CF maps shown in Fig. 2. Spike rates (spikes/sec) for each individual frequency-level combination were compared directly between contralateral and ipsilateral FRAs. Right column: Individual frequency-level combinations were assigned a numeric indicator to reflect contralateral dominance (1, white), ipsilateral dominance (−1, black) or bilateral equivalence (0, gray) in spike rate. (B and C) Mean aural dominance index for each recording site was divided into 7 categories reflecting the spectrum between complete contralateral dominance to complete ipsilateral dominance (1 to 7, respectively). Distributions of aural dominance scores across the entire sample of recordings sites in sham (red) and MD (gray) recordings are shown for AI (B) and ICc (C) for each age group. P values reflect outcome of Kolmogorov-Smirnov tests. (D and E) Average z scores from onset latency, minimum response threshold and receptive field continuity distributions. Higher z scores reflect more efficacious inputs. Data are shown from responses evoked by contra/ligated and ipsilateral/open (ipsi)ears in 2wks (2), 4wks (4) and adult (A) rats from sham (red) and MD (gray) AI (D) and ICc (E) recordings. Asterisks = p < 0.05 with unpaired t-test, N.S. = not significant. See also Figures S1, S2 and S3.
Figure 5
Figure 5. Experience-dependent changes in trial-by-trial variability
(A and B) Raster plots illustrate spike count and timing from single neurons recorded in sham 2wks (A) or MD 2wks (B) rats. Rasters are constructed from 20 repetitions of contralateral/ligated (C, black dots) and ipsilateral/open (I, gray dots) 70 dB SPL tones at the BF. Tones are presented independently to each ear with SOA = 800 ms. Inset: action potential waveforms for each single unit. (C and D) Percentage of trials with no spikes from contralateral/ligated and ipsilateral/open inputs in sham (open bars) and MD (shaded bars) AI (C) and ICc (D) recordings. (E–H) Coefficient of variation (CV) in first spike latency (E and F) and spike count (G and H, respectively) from AI (E and G) and ICc (F and H) recordings. Asterisks denote unpaired t-test, p < 0.05.
Figure 6
Figure 6. Bi-directional shifts in contralateral and ipsilateral classification accuracy
(A and B) PSTH-based model performance for classification of tone frequency delivered to the contralateral/ligated (left column) and ipsilateral/open (right column) ears in single unit ensembles from sham (open symbols, solid line) and MD (gray symbols, broken line) rats. Asterisks denote significant differences between sham and MD classification accuracy based on unpaired t-tests (p < 0.05). See also Figure S4.
Figure 7
Figure 7. MD disrupts binaural integration
(A) Representative binaural interaction matrix reconstructed from an ICc unit recorded in a 2wk sham-operated rat. Bandlimited noise bursts centered on the CF of each neuron were presented at 64 interaural level combinations. Contralateral response suppression was greatest when ipsilateral level is high and contralateral level close to threshold, but diminished as ipsilateral level decreased and/or contralateral level increased. The blue box represents the set of 19 interaural level combinations selected for quantification of binaural integration, constrained to ILD ± 20 dB and absolute level within 40 dB of contralateral threshold. Binaural suppression was quantified by comparing the firing rate for each combination relative to the linear sum of their monaural intercepts (e.g. blue cross (ILD = −10) relative to sum of green and red cross). (B) Cartoon represents the placement of recording electrodes in ICc and AI from both hemispheres superimposed on a horizontal section of the rat brain. (C and D), Binaural interaction matrices from AI (C) and ICc (D) in sham rats (left column), MD rats ipsilateral to the ligated ear (middle column) and contralateral to the ligated ear (right column). Color scale and axis labels in A applies to all plots. See also Figure S6.
Figure 8
Figure 8. Bilateral effects of MD on ILD encoding
Ipsilaterally mediated inhibition expressed as a function of ILD (ipsilateral (I) level – contralateral (C) level) for AI (A) and ICC (B) recordings made in sham rats (open symbols), MD rats ipsilateral to the ligated ear (black symbols) and MD rats contralateral to the ligated ear (gray symbols). (C) Ipsilaterally mediated inhibition averaged across all ILD combinations above is plotted alongside levels of ipsilateral excitation for AI (circles) and ICc (squares). Asterisks denote significant differences for unpaired t-tests (p < 0.025 after correction for multiple comparisons) comparisons between sham vs. contra to ligation (gray *) and sham vs. ipsi to ligation (black *). See also Figure S6.

Similar articles

Cited by

References

    1. Atiani S, Elhilali M, David SV, Fritz JB, Shamma SA. Task difficulty and performance induce diverse adaptive patterns in gain and shape of primary auditory cortical receptive fields. Neuron. 2009;61:467–480. - PMC - PubMed
    1. Bajo VM, Nodal FR, Moore DR, King AJ. The descending corticocollicular pathway mediates learning-induced auditory plasticity. Nat Neurosci. 2010;13:253–260. - PMC - PubMed
    1. Bendor D, Wang X. Differential neural coding of acoustic flutter within primate auditory cortex. Nat Neurosci. 2007;10:763–771. - PubMed
    1. Chang EF, Merzenich MM. Environmental noise retards auditory cortical development. Science. 2003;300:498–502. - PubMed
    1. Clements M, Kelly JB. Auditory spatial responses of young guinea pigs (Cavia porcellus) during and after ear blocking. J Comp Physiol Psychol. 1978;92:34–44. - PubMed

Publication types

MeSH terms

LinkOut - more resources