. 2010 May 21;285(21):15816-27.
doi: 10.1074/jbc.M109.040097. Epub 2010 Mar 11.

Mycobacterium tuberculosis origin of replication and the promoter for immunodominant secreted antigen 85B are the targets of MtrA, the essential response regulator

Affiliations

Mycobacterium tuberculosis origin of replication and the promoter for immunodominant secreted antigen 85B are the targets of MtrA, the essential response regulator

Malini Rajagopalan et al. J Biol Chem. .

Abstract

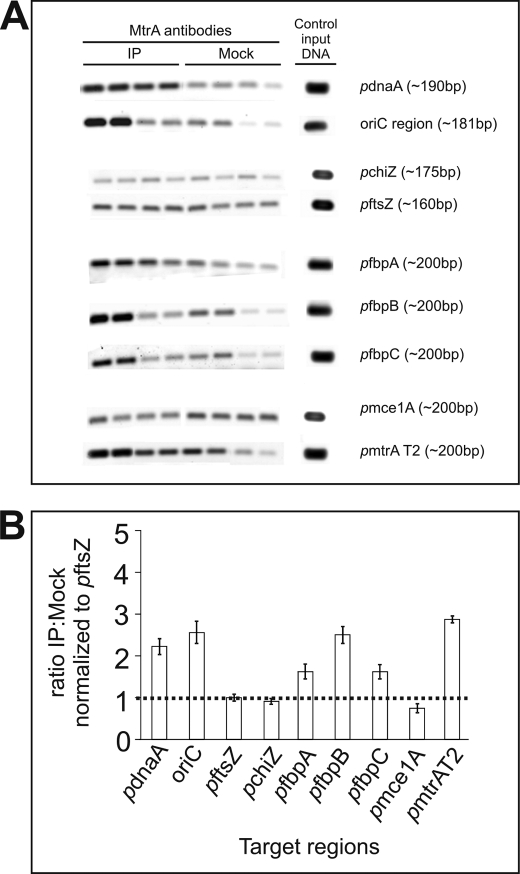
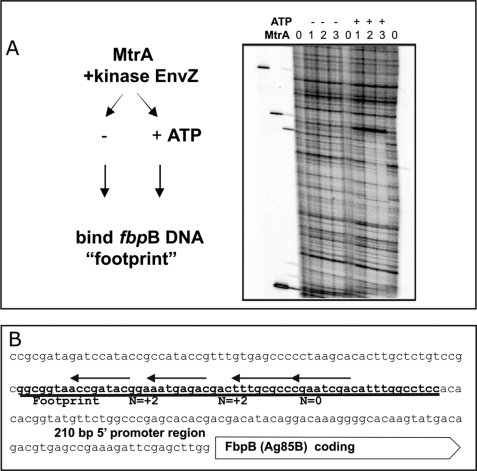
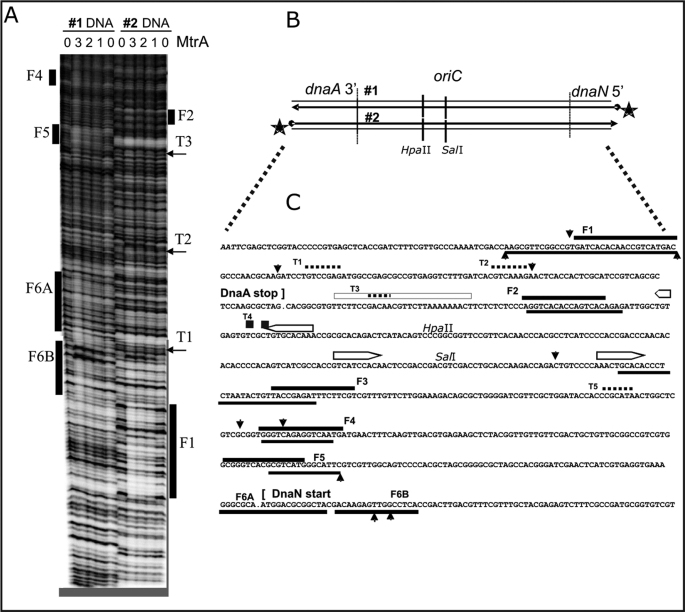
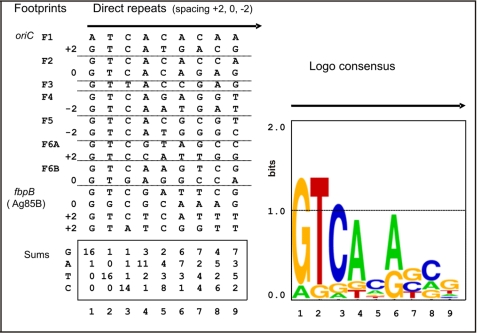
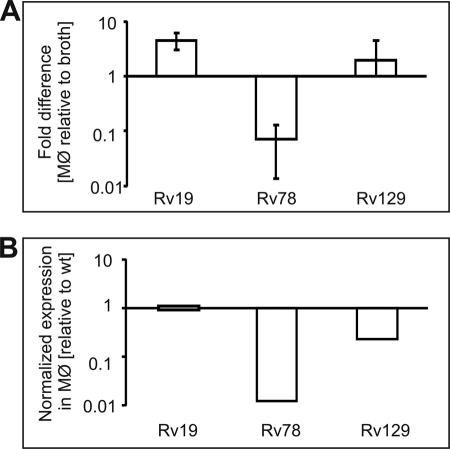
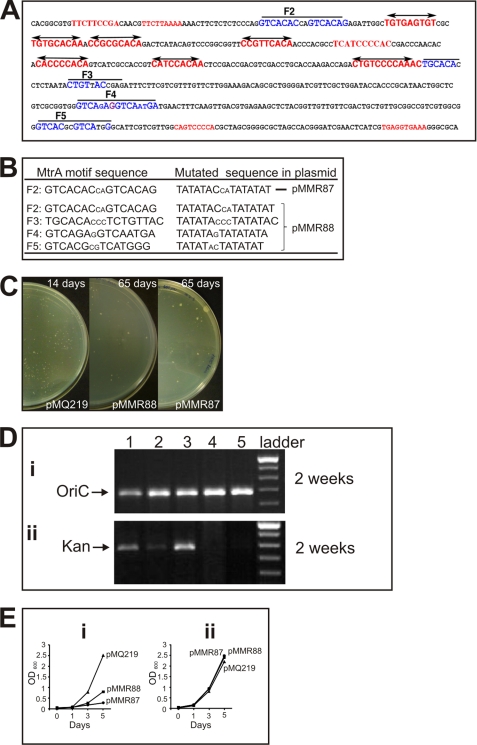
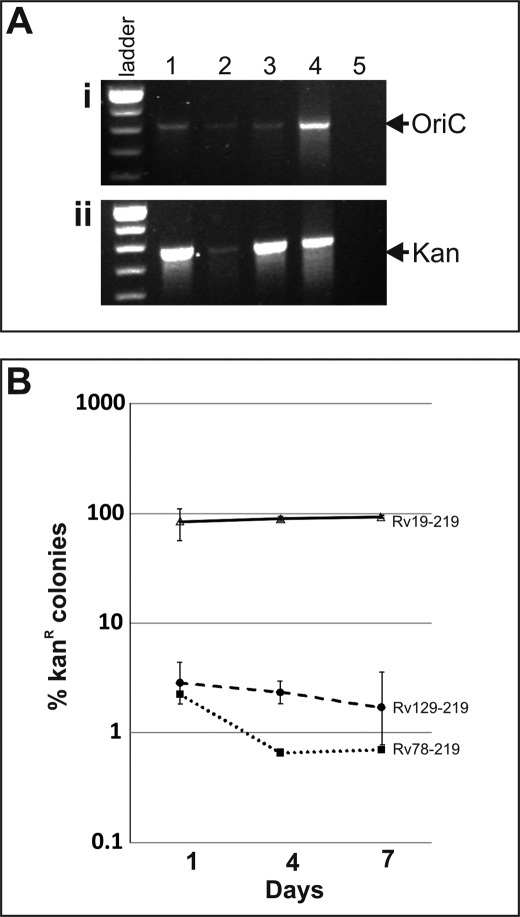
Efficient proliferation of Mycobacterium tuberculosis (Mtb) inside macrophage requires that the essential response regulator MtrA be optimally phosphorylated. However, the genomic targets of MtrA have not been identified. We show by chromatin immunoprecipitation and DNase I footprinting that the chromosomal origin of replication, oriC, and the promoter for the major secreted immunodominant antigen Ag85B, encoded by fbpB, are MtrA targets. DNase I footprinting analysis revealed that MtrA recognizes two direct repeats of GTCACAgcg-like sequences and that MtrA approximately P, the phosphorylated form of MtrA, binds preferentially to these targets. The oriC contains several MtrA motifs, and replacement of all motifs or of a single select motif with TATATA compromises the ability of oriC plasmids to maintain stable autonomous replication in wild type and MtrA-overproducing strains, indicating that the integrity of the MtrA motif is necessary for oriC replication. The expression of the fbpB gene is found to be down-regulated in Mtb cells upon infection when these cells overproduce wild type MtrA but not when they overproduce a nonphosphorylated MtrA, indicating that MtrA approximately P regulates fbpB expression. We propose that MtrA is a regulator of oriC replication and that the ability of MtrA to affect apparently unrelated targets, i.e. oriC and fbpB, reflects its main role as a coordinator between the proliferative and pathogenic functions of Mtb.


Figures

FIGURE 1.
FIGURE 1.
ChIP experiments. A, agarose gel analysis of ChIP samples. Mtb cell lysates following formaldehyde cross-linking, immunoprecipitation (IP) with anti-MtrA or mock antibodies, and heat reversal of cross-links were used in PCR with select targets. Lysates were diluted 50- and 200-fold for oriC and the promoters of ftsZ, dnaA, chiZ, fbpA, fbpB, and fbpC promoters. For mtrA promoters, 100- and 300-fold diluted lysates were used. PCRs were done in duplicate, and products were resolved by agarose gel electrophoresis, stained with SYBR Green dye, and visualized by scanning in Molecular Imager Fx. Product lanes corresponding to anti-MtrA and Mock antibodies and the target in question are marked. Control input DNA refers to PCR products wherein an aliquot of suitably diluted genomic DNA was used with appropriate primers in amplification reactions. Representative data for each target are shown. B, normalization of ChIP data. PCR products obtained were scanned by densitometry and analyzed by Quantity One software (Bio-Rad Molecular Imager Fx). The ratio of anti-MtrA to mock immunoprecipitation signals was determined for each primer pair and normalized against that of the FtsZ promoter value. The y axis shows the normalized anti-MtrA to mock ratio, and the x axis shows the individual targets.
FIGURE 2.
FIGURE 2.
MtrA footprint analysis in the 5′ region of fbpB (Ag85B). A, MtrA binding requires ATP in the protein kinase reaction. Purified His-tagged MtrA protein was phosphorylated by incubation with soluble maltose-binding protein-tagged E. coli EnvZ kinase and 1.0 mm ATP for 30 min prior to the DNase I protection “footprint” analysis using the 32P- 5′-end-labeled DNA fragment, as detailed under “Materials and Methods,” which spans the upstream region of fbpB. The numbers (0, 1, 2, 3) above the lanes indicate that either 0, 10, 20, or 30 μl of the phosphorylated MtrA (2 mg/ml MtrA protein) was added to the standard 200-μl binding reactions. The − or + signs indicate that ATP was either absent or present in otherwise identical reactions. B, DNA sequences bound by MtrA. The DNA sequences immediately upstream to the annotated M. tuberculosis FbpB coding DNA are shown. The zone of MtrA-specific DNase I protection, presented above in footprints A and B, is underlined. The arrows above this footprint align with the best matches to the direct repeats (with variable n = 2 or n = 0 bp spacing). These are the proposed MtrA recognition sequences that are described in the text and in Fig. 5.
FIGURE 3.
FIGURE 3.
MtrA footprint analysis in the M. tuberculosis oriC region, between 3′ dnaA and 5′ dnaN. A, two representative autoradiograms (#1 and #2) using 32P-5′-end-labeled DNA, diagrammed in B, at the 5′-end of dnaN (#1) and the 3′-end of dnaA (#2). Purified His-tagged MtrA protein was phosphorylated as described in Fig. 2, prior to the DNase I protection footprint analysis, also detailed under “Materials and Methods.” The numbers (0, 1, 2, 3) above the lanes indicate that either 0, 10, 20, or 30 μl of the MtrA (2 mg/ml protein) was added to the standard 200-μl binding reactions. Similarly aligned bars and arrows mark the footprints (F1, F2, … F6A, F6B) and shorter toe prints (T1, T2 …) that are described in the text and aligned with the DNA sequence in C. B, schematic diagram of the M. tuberculosis oriC region is aligned with the 32P-end-labeled DNA (#1 and #2) used in A. The indicated HpaII and SalI sites also served as positions for 32P-end-labeled DNA used in additional footprint experiments not shown. C, summary of MtrA footprint analysis in the M. tuberculosis oriC region. These DNA sequences correspond with the above oriC schematic in B and with the footprints in A. It also summarizes footprint experiments (using internally labeled HpaII and SalI sites) that are not shown. The open bars with pointed ends mark established DnaA-boxes (9). Solid bars mark the footprints (F1, F2, … F6A, F6B), and dotted lines mark the shorter toe prints (T1, T2 …). Perpendicular arrowheads mark the prominent DNase I cut sites that are enhanced by MtrA. When positioned below the presented DNA sequences, these lines and arrows indicate the sequences protected or cleaved on the corresponding bottom strand.
FIGURE 4.
FIGURE 4.
Motif log analysis. MtrA binds by apparently recognizing two or more direct repeats similar to GTCACA. The DNA sequences under the footprints in Figs. 2 and 3 were aligned to assume optimum similarity. For 6 out of the 7 oriC footprints, shown in Fig. 3C, the best aligned DNA could be organized as two direct repeats, but a variable spacing of +2, 0 or −2 bp was required for alignment. The exceptional footprint F3 apparently contained only one direct repeat. Frequency and Logo analysis suggests that most of the sequence conservation and presumably most of the information that specifies selective DNA binding lies in the first six positions (GTCACA). Four similar but less exact direct repeats with n = 0, n = +2, and n = +2-bp spacing are also present under the MtrA footprint 5′ to fbpB (Fig. 3C). The supplemental Fig. S3 demonstrates that the n = +2-bp spacing provides a higher affinity than n = 0.
FIGURE 5.
FIGURE 5.
Quantitative real time-PCR analysis of fbpB gene expression. The cDNA specific to fbpB and 16 S rRNA genes was synthesized from the RNA samples of Rv19 Mtb (WT), Rv78 Mtb(MtrA+), and Rv129 Mtb (D53N MtrA+) strains grown in broth and macrophages and used to evaluate fbpB expression relative to 16 S rRNA. Data are presented as fold-differences in the expression of macrophage-grown bacteria relative to broth (A). The fbpB RNA expression data of Rv78 and Rv129 were normalized against the wild type strain and are also presented (B).
FIGURE 6.
FIGURE 6.
oriC sequence, MtrA direct repeat mutations, and oriC plasmid transformation assays. A, oriC sequence (the dnaA-dnaN intergenic region). DnaA-boxes are marked in red, and MtrA-boxes are marked in blue. Mutated residues in the MtrA-boxes F2, F3, F4, and F5 are shown. B, mutated MtrA-box sequences. The presumptive MtrA motifs and the sequences of the mutated boxes are shown for clarity. The plasmid pMMR87 contains only the first F2 mutation and pMMR88 contains all four mutations. C, oriC transformants on agar plates. Approximately 250 ng of WT (pMQ219) and mutant (pMMR87 and pMMR88) plasmid DNA was electrotransformed into Mtb H37Rv WT, and plates were incubated at 37 °C. The pMQ219 transformants in WT background were photographed after 14 days, and the pMMR87 and pMMR88 transformants were photographed after 65 days. D, agarose gel showing oriC and kan cassette PCR products. Genomic DNA of the transformants of pMQ219, pMMR87, pMMR88, and control pZErO 2.1 were extracted and used as templates to amplify oriC (panel i) and the kan cassette (panel ii). The PCR products were resolved on 0.8% agarose gels, stained with ethidium bromide, and photographed. Lane 1, pMQ219; lane 2, pMMR87; lane 3, pMMR88; lane 4, Rv WT; lane 5, pZErO 2.1; lane 6, 1-kb DNA ladder. E, growth curves of Mtb merodiploid strains. The frozen stocks of pooled transformants of pMMR87 and pMMR88 were diluted in Middlebrook 7H9 broth supplemented with oleic acid/dextrose/albumin/sodium chloride with 10 μg/ml kan (in panel i) and without antibiotic (in panel ii) and grown for 10 days to a final A600 between 0.25 and 0.3. The cultures were then diluted to A600 of 0.05, and the growth was monitored daily, as shown. For pMQ219, the freezer stocks were diluted and grown for 3 days to A600 of 0.6 prior to diluting to a final A600 of 0.025. Note that the growth rates of these cultures are very similar when grown in the absence of antibiotic. Similar results were also obtained when antibiotic concentration was increased to 25 μg/ml (data not shown).
FIGURE 7.
FIGURE 7.
Effect of MtrA overproduction on pMQ219 plasmid stability. A, agarose gel showing oriC and kan cassettes. Genomic DNA preparations of Mtb merodiploid strains overproducing WT Mtb(MtrA+) and phosphorylation-defective Mtb(D53N, MtrA+) MtrA proteins, along with the control (RV19), were analyzed by PCR for oriC (panel i) and kan (panel ii). Lane 1, Rv19; lane 2, Rv78; lane 3, Rv129, lane 4, pMQ219 plasmid; and lane 5, Rv WT. B, stability experiments are as follows: Mtb merodiploids actively growing in broth in the absence of kan were diluted at indicated time periods, spread on agar plates with and without kan, and viable colonies appearing after 3 weeks incubation were determined. The ratio of kan-resistant colonies among total cells were presented on semi-log scale.

Similar articles

Cited by

References

    1. North R. J., Jung Y. J. (2004) Annu. Rev. Immunol. 22, 599–623 - PubMed
    1. Kaufmann S. H., Cole S. T., Mizrahi V., Rubin E., Nathan C. (2005) J. Exp. Med. 201, 1693–1697 - PMC - PubMed
    1. Smith I. (2003) Clin. Microbiol. Rev. 16, 463–496 - PMC - PubMed
    1. Cole S. T., Brosch R., Parkhill J., Garnier T., Churcher C., Harris D., Gordon S. V., Eiglmeier K., Gas S., Barry C. E., 3rd, Tekaia F., Badcock K., Basham D., Brown D., Chillingworth T., Connor R., Davies R., Devlin K., Feltwell T., Gentles S., Hamlin N., Holroyd S., Hornsby T., Jagels K., Krogh A., McLean J., Moule S., Murphy L., Oliver K., Osborne J., Quail M. A., Rajandream M. A., Rogers J., Rutter S., Seeger K., Skelton J., Squares R., Squares S., Sulston J. E., Taylor K., Whitehead S., Barrell B. G. (1998) Nature 393, 537–544 - PubMed
    1. Hoch J. A. (2000) Curr. Opin. Microbiol. 3, 165–170 - PubMed

Publication types

MeSH terms

Substances

LinkOut - more resources