

S-glutathionylation regulates inflammatory activities of S100A9
- PMID: 20223829
- PMCID: PMC2863208
- DOI: 10.1074/jbc.M109.075242
S-glutathionylation regulates inflammatory activities of S100A9
Abstract
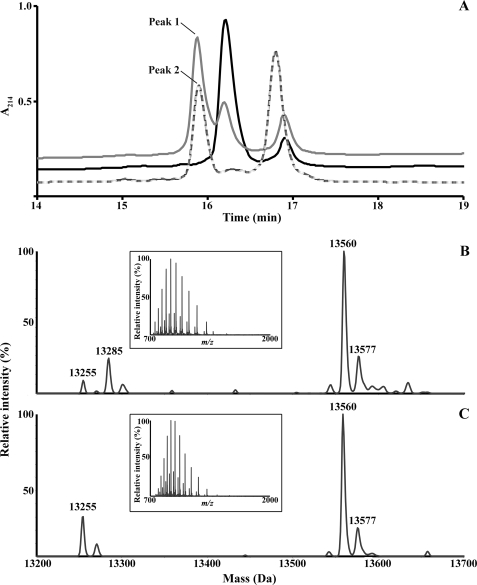
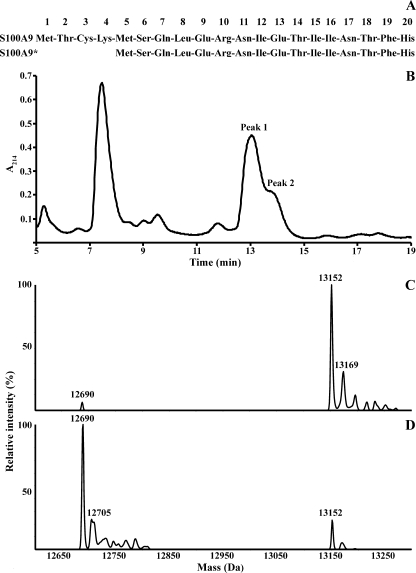
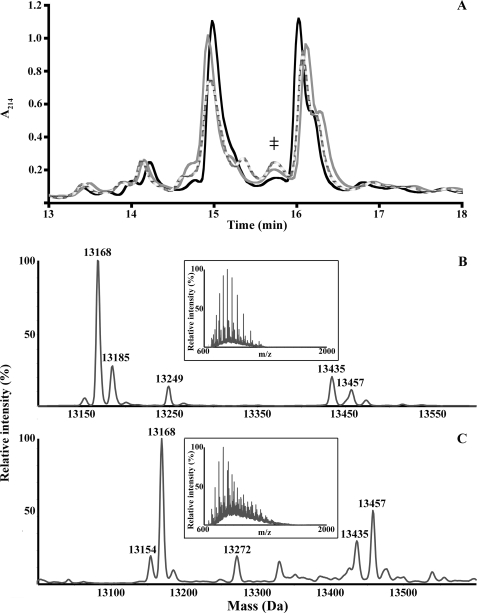
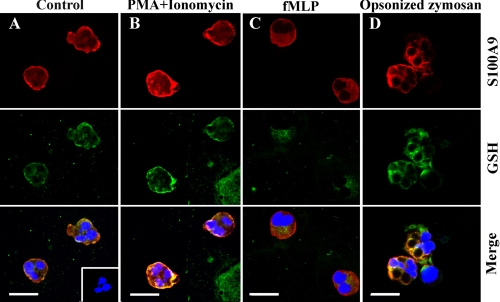
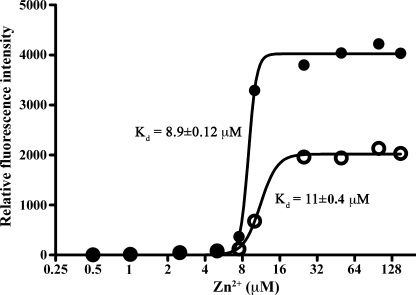
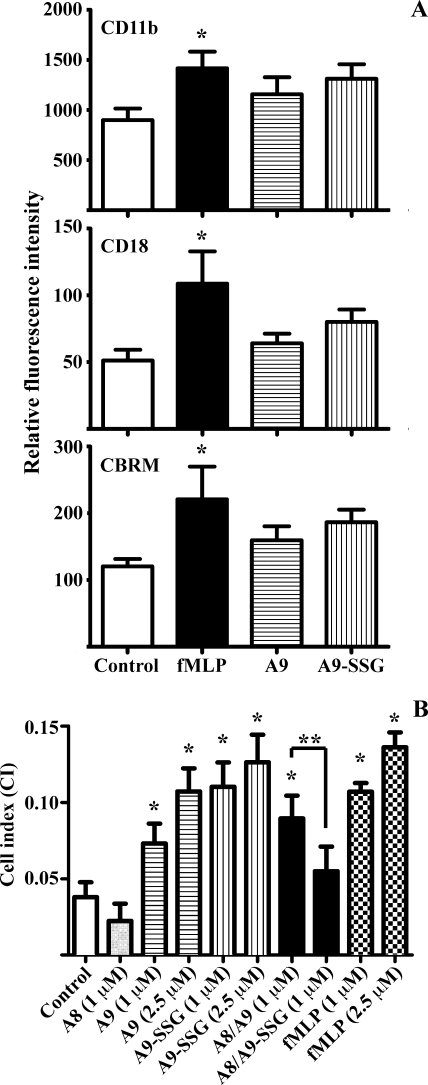
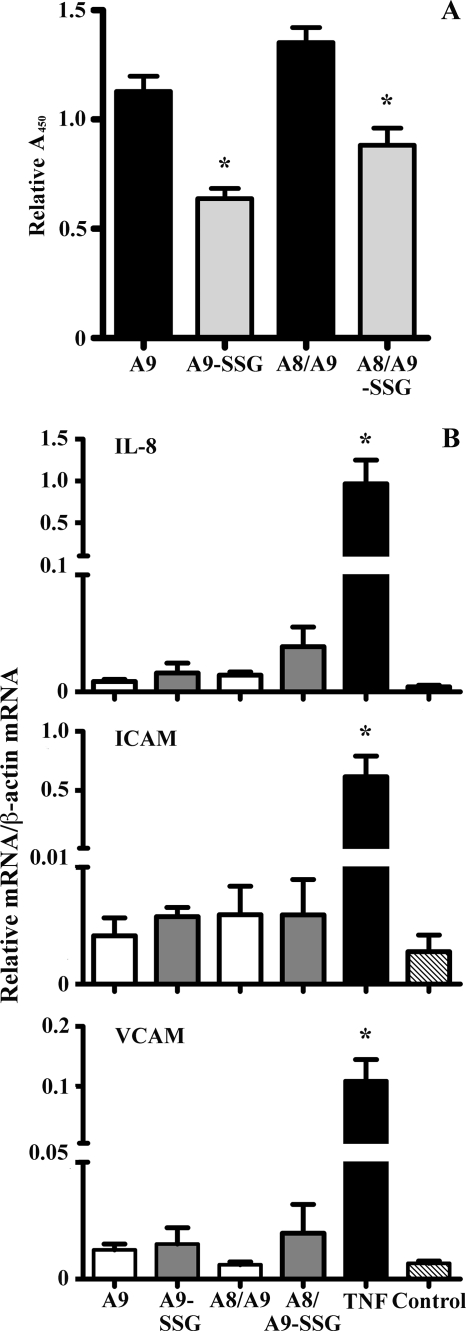
Reactive oxygen species generated by activated neutrophils can cause oxidative stress and tissue damage. S100A8 (A8) and S100A9 (A9), abundant in neutrophil cytoplasm, are exquisitely sensitive to oxidation, which may alter their functions. Murine A8 is a neutrophil chemoattractant, but it suppresses leukocyte transmigration in the microcirculation when S-nitrosylated. Glutathione (GSH) modulates intracellular redox, and S-glutathionylation can protect susceptible proteins from oxidative damage and regulate function. We characterized S-glutathionylation of A9; GSSG and GSNO generated S-glutathionylated A8 (A8-SSG) and A9 (A9-SSG) in vitro, whereas only A9-SSG was detected in cytosol of neutrophils activated with phorbol myristate acetate (PMA) but not with fMLP or opsonized zymosan. S-Glutathionylation exposed more hydrophobic regions in Zn(2+)-bound A9 but did not alter Zn(2+) binding affinity. A9-SSG had reduced capacity to form heterocomplexes with A8, but the arachidonic acid binding capacities of A8/A9 and A8/A9-SSG were similar. A9 and A8/A9 bind endothelial cells; S-glutathionylation reduced binding. We found little effect of A9 or A9-SSG on neutrophil CD11b/CD18 expression or neutrophil adhesion to endothelial cells. However, A9, A9-SSG and A8/A9 promoted neutrophil adhesion to fibronectin but, in the presence of A8, A9-mediated adhesion was abrogated by glutathionylation. S-Glutathionylation of A9 may protect its oxidation to higher oligomers and reduce neutrophil binding to the extracellular matrix. This may regulate the magnitude of neutrophil migration in the extravasculature, and together with the functional changes we reported for S-nitrosylated A8, particular oxidative modifications of these proteins may limit tissue damage in acute inflammation.
Figures
Similar articles
-
S100A8/A9 Is a Marker for the Release of Neutrophil Extracellular Traps and Induces Neutrophil Activation.Cells. 2022 Jan 11;11(2):236. doi: 10.3390/cells11020236. Cells. 2022. PMID: 35053354 Free PMC article.
-
Proinflammatory activities of S100: proteins S100A8, S100A9, and S100A8/A9 induce neutrophil chemotaxis and adhesion.J Immunol. 2003 Mar 15;170(6):3233-42. doi: 10.4049/jimmunol.170.6.3233. J Immunol. 2003. PMID: 12626582
-
Secretion of the Phosphorylated Form of S100A9 from Neutrophils Is Essential for the Proinflammatory Functions of Extracellular S100A8/A9.Front Immunol. 2018 Mar 13;9:447. doi: 10.3389/fimmu.2018.00447. eCollection 2018. Front Immunol. 2018. PMID: 29593718 Free PMC article.
-
Oxidative modifications of DAMPs suppress inflammation: the case for S100A8 and S100A9.Antioxid Redox Signal. 2011 Oct 15;15(8):2235-48. doi: 10.1089/ars.2010.3641. Epub 2011 Apr 11. Antioxid Redox Signal. 2011. PMID: 20919939 Review.
-
Emerging roles of neutrophil-borne S100A8/A9 in cardiovascular inflammation.Pharmacol Res. 2020 Nov;161:105212. doi: 10.1016/j.phrs.2020.105212. Epub 2020 Sep 28. Pharmacol Res. 2020. PMID: 32991974 Free PMC article. Review.
Cited by
-
Dysregulation of the glutaredoxin/S-glutathionylation redox axis in lung diseases.Am J Physiol Cell Physiol. 2020 Feb 1;318(2):C304-C327. doi: 10.1152/ajpcell.00410.2019. Epub 2019 Nov 6. Am J Physiol Cell Physiol. 2020. PMID: 31693398 Free PMC article.
-
Review of S100A9 biology and its role in cancer.Biochim Biophys Acta. 2013 Jan;1835(1):100-9. doi: 10.1016/j.bbcan.2012.10.003. Epub 2012 Nov 1. Biochim Biophys Acta. 2013. PMID: 23123827 Free PMC article. Review.
-
S100a9 Protects Male Lupus-Prone NZBWF1 Mice From Disease Development.Front Immunol. 2021 Jun 17;12:681503. doi: 10.3389/fimmu.2021.681503. eCollection 2021. Front Immunol. 2021. PMID: 34220829 Free PMC article.
-
S100A12 and the Airway Smooth Muscle: Beyond Inflammation and Constriction.J Allergy Ther. 2012 Apr 20;3(Suppl 1):S1-007. doi: 10.4172/2155-6121.S1-007. J Allergy Ther. 2012. PMID: 25984393 Free PMC article.
-
Comprehensive Proteomic and Metabolomic Signatures of Nontypeable Haemophilus influenzae-Induced Acute Otitis Media Reveal Bacterial Aerobic Respiration in an Immunosuppressed Environment.Mol Cell Proteomics. 2016 Mar;15(3):1117-38. doi: 10.1074/mcp.M115.052498. Epub 2015 Dec 28. Mol Cell Proteomics. 2016. PMID: 26711468 Free PMC article.
References
-
- Smith J. A. (1994) J. Leukocyte Biol. 56, 672–686 - PubMed
-
- Hampton M. B., Kettle A. J., Winterbourn C. C. (1998) Blood 92, 3007–3017 - PubMed
-
- Ryter S. W., Kim H. P., Hoetzel A., Park J. W., Nakahira K., Wang X., Choi A. M. (2007) Antioxid. Redox Signal. 9, 49–89 - PubMed
-
- Hultqvist M., Olsson L. M., Gelderman K. A., Holmdahl R. (2009) Trends Immunol. 30, 201–208 - PubMed
-
- Niwa T. (2007) J. Chromatogr. B Analyt. Technol. Biomed. Life Sci. 855, 59–65 - PubMed
Publication types
MeSH terms
Substances
LinkOut - more resources
Full Text Sources
Research Materials
Miscellaneous
