. 2010 Mar 12;327(5971):1380-5.
doi: 10.1126/science.1181729.

Restriction of receptor movement alters cellular response: physical force sensing by EphA2

Affiliations

Restriction of receptor movement alters cellular response: physical force sensing by EphA2

Khalid Salaita et al. Science. .

Abstract

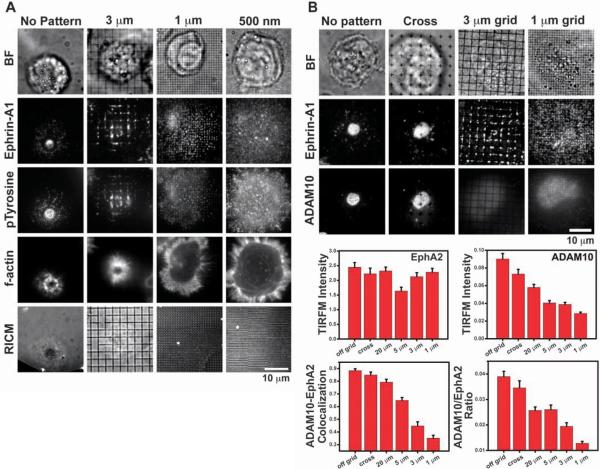
Activation of the EphA2 receptor tyrosine kinase by ephrin-A1 ligands presented on apposed cell surfaces plays important roles in development and exhibits poorly understood functional alterations in cancer. We reconstituted this intermembrane signaling geometry between live EphA2-expressing human breast cancer cells and supported membranes displaying laterally mobile ephrin-A1. Receptor-ligand binding, clustering, and subsequent lateral transport within this junction were observed. EphA2 transport can be blocked by physical barriers nanofabricated onto the underlying substrate. This physical reorganization of EphA2 alters the cellular response to ephrin-A1, as observed by changes in cytoskeleton morphology and recruitment of a disintegrin and metalloprotease 10. Quantitative analysis of receptor-ligand spatial organization across a library of 26 mammary epithelial cell lines reveals characteristic differences that strongly correlate with invasion potential. These observations reveal a mechanism for spatio-mechanical regulation of EphA2 signaling pathways.


Figures

Fig. 1
Fig. 1
Scheme of the experimental platform used to trigger and manipulate the EphA2 receptor on the surface of living cells. EphA2-expressing mammary epithelial cells are cultured onto a supported membrane displaying laterally mobile, fluorescently labeled ephrin-A1 ligand. Receptors engage ligands, form clusters that coalesce, and are transported to the center of the cell–supported membrane junction. Nanofabricated chromium metal lines 10 nm in height and 100 nm in linewidth (left cell) act as diffusion barriers and impede the transport of receptor-ligand complexes, leading to an accumulation of Eph-ephrin clusters at boundaries.
Fig. 2
Fig. 2
Mechanical reorganization of ligand-stimulated EphA2. (A) Representative bright field and epifluorescence images of MDA-MB-231 cells within 1 hour of interaction with an Alexa Fluor 647–tagged ephrin-A1–functionalized supported membrane. (B) Dynamics of receptor-ligand reorganization as a function of time. The radial distribution of ephrin-A1 was measured under each cell, and the population average value (n = 77 cells) is indicated above the fluorescence image for each time point. (C) The central EphA2 cluster is the region of highest ephrin-A1 concentration, greatest tyrosine phosphorylation, and tightest cell adhesion to the substrate and results in reorganization of the actin cytoskeleton to form a peripheral annulus. Scale bar is 5 μm in (A) to (C). (D) Representative bright field, epifluorescence, and RICM images of cells 1 hour after plating on a supported membrane functionalized with binary mixtures of ephrin-A1 and cyclic RGD peptide. Ephrin-A1 and RGD were incubated in the molar ratios indicated above each panel and show EphA2 translocation regardless of the area of the cell–supported membrane contact. (E) Mechanical reorganization of EphA2 requires a fluid membrane. Bilayers composed of 99.9% DPPC and 0.1% biotin-DPPE are not fluid during cell engagement at 37°C; as a result, no long-range EphA2 reorganization is observed on DPPC bilayers. (F) Western blots of lysates collected from 1 × 10⁵ cells cultured onto fluid and nonfluid membranes. Presentation of fluid ephrin-A1 results in more rapid and complete EphA2 activation than presentation of nonfluid ephrin-A1, as measured by EphA2 degradation and total phosphorylated tyrosine intensities. EphA2 bands are at a mass of ~100 kD. (G) When cells were treated with the Rho kinase inhibitor Y-27632, a dosage-dependent decrease in Eph-ephrin radial transport was observed (n = 627 cells), demonstrating that the cytoskeleton drives radial transport. Experiments were performed in duplicate, and radial transport was independently normalized to untreated samples from each replicate. Error bars indicate SE for at least 139 cells at each dosage.
Fig. 3
Fig. 3
The functional consequences of EphA2 spatial mutation. Lateral transport of the EphA2 receptor is hindered by nanoscale chromium lines (10 nm in height and 100 nm in linewidth) prefabricated onto the glass support. MDA-MB-231 cells were allowed to engage the ephrin-A1 functionalized supported membrane for 1 hour, then they were fixed and stained for recruitment of downstream effector molecules. (A) Irrespective of the presence or the scale of spatial mutations, phoshorylated tyrosine colocalized with ephrin-A1. F-actin adopted an annulus peripheral to the receptor-ligand assembly when EphA2 transport was unrestricted. However, when EphA2 organization was altered, the cytoskeleton assumed a spread morphology with f-actin primarily present in peripheral lamellipodia. The spread actin morphology switched to an annulus surrounding the EphA2-ephrin-A1 assembly when cells were exposed to 3-μm–pitch barriers. (B) ADAM10 colocalized with the EphA2-ephrin-A1 assembly on unrestricted supported membranes. However, when EphA2 transport was restricted by metal lines on the silica substrate, the measured colocalization decreased, and the ratio of ADAM10 to EphA2 also decreased (n = 477 cells). This indicates that mechanical restriction of EphA2 modulates ADAM10 recruitment.
Fig. 4
Fig. 4
Correlation of EphA2 radial transport to molecular and behavior properties in breast cancer. The average ephrin-A1 ligand radial distribution functions for 26 cell lines are quantified, parameterized, and then used as a spatial biomarker that is directly correlated to known biological characteristics and proteomic and genomic expression levels. (A) The average radial distribution function was found to exhibit a strong correlation (r =0.91, p=7× 10⁻⁸) to invasion potentials that were determined with modified Boyden chamber analysis. (B) The proteomic correlates (p < 0.1) of EphA2 radial transport are shown in the table with their associated p values and are grouped based on the type of association (positive or negative). Proteins highlighted in red are those whose role in EphA2 reorganization has been experimentally observed. (C) Transcriptomic correlates (p < 1 × 10⁻⁴, false discovery rate < 5 × 10⁻³) of EphA2 radial transport are illustrated in a heat map. Unsupervised hierarchical clustering of expression profiles of mRNAs that are predicted to be surrogates of EphA2 radial transport shows two distinct clusters of cell lines associated with the phenotype. Red indicates up-regulated expression, whereas green indicates down-regulated expression. (D) Representative bright field, epifluorescence immunostaining, and RICM images of a cell 1 hour after plating on a supported membrane functionalized with ephrin-A1. The cell adhesion molecule CD44 was found to be substantially up-regulated in protein expression in cells that underwent EphA2 radial transport. This signaling molecule was also found to be antilocalized with EphA2 upon ligand-induced activation.

Comment in

References

    1. Discher DE, Janmey P, Wang Y.-l. Science. 2005;310:1139. - PubMed
    1. Dalby MJ, et al. Nat. Mater. 2007;6:997. - PubMed
    1. Nelson CM, VanDuijn MM, Inman JL, Fletcher DA, Bissell MJ. Science. 2006;314:298. - PMC - PubMed
    1. Butcher DT, Alliston T, Weaver VM. Nat. Rev. Cancer. 2009;9:108. - PMC - PubMed
    1. Chen CS. J. Cell Sci. 2008;121:3285. - PubMed

Publication types

MeSH terms