CD4 and CD8 T-cell responses to mycobacterial antigens in African children
- PMID: 20224065
- PMCID: PMC2902756
- DOI: 10.1164/rccm.200912-1862OC
CD4 and CD8 T-cell responses to mycobacterial antigens in African children
Abstract
Rationale: The current tuberculosis (TB) vaccine, bacille Calmette-Guérin (BCG), does not provide adequate protection against TB disease in children. Furthermore, more efficacious TB vaccines are needed for children with immunodeficiencies such as HIV infection, who are at highest risk of disease.
Objectives: To characterize mycobacteria-specific T cells in children who might benefit from vaccination against TB, focusing on responses to antigens contained in novel TB vaccines.
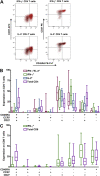
Methods: Whole blood was collected from three groups of BCG-vaccinated children: HIV-seronegative children receiving TB treatment (n = 30), HIV-infected children (n = 30), and HIV-unexposed healthy children (n = 30). Blood was stimulated with Ag85B and TB10.4, or purified protein derivative, and T-cell cytokine production by CD4 and CD8 was determined by flow cytometry. The memory phenotype of antigen-specific CD4 and CD8 T cells was also determined.
Measurements and main results: Mycobacteria-specific CD4 and CD8 T-cell responses were detectable in all three groups of children. Children receiving TB treatment had significantly higher frequencies of antigen-specific CD4 T cells compared with HIV-infected children (P = 0.0176). No significant differences in magnitude, function, or phenotype of specific T cells were observed in HIV-infected children compared with healthy control subjects. CD4 T cells expressing IFN-gamma, IL-2, or both expressed a CD45RA(-)CCR7(-)CD27(+/-) effector memory phenotype. Mycobacteria-specific CD8 T cells expressed mostly IFN-gamma in all groups of children; these cells expressed CD45RA(-)CCR7(-)CD27(+/-) or CD45RA(+)CCR7(-)CD27(+/-) effector memory phenotypes.
Conclusions: Mycobacteria-specific T-cell responses could be demonstrated in all groups of children, suggesting that the responses could be boosted by new TB vaccines currently in clinical trials.
Figures


Similar articles
-
The safety and immunogenicity of an adenovirus type 35-vectored TB vaccine in HIV-infected, BCG-vaccinated adults with CD4(+) T cell counts >350 cells/mm(3).Vaccine. 2015 Apr 8;33(15):1890-6. doi: 10.1016/j.vaccine.2015.02.004. Epub 2015 Feb 17. Vaccine. 2015. PMID: 25698492 Clinical Trial.
-
Dendritic cells induce CD4+ and CD8+ T-cell responses to Mycobacterium bovis and M. avium antigens in Bacille Calmette Guérin vaccinated and nonvaccinated cattle.Scand J Immunol. 2000 Sep;52(3):285-91. doi: 10.1046/j.1365-3083.2000.00780.x. Scand J Immunol. 2000. PMID: 10972905
-
The candidate TB vaccine, MVA85A, induces highly durable Th1 responses.PLoS One. 2014 Feb 3;9(2):e87340. doi: 10.1371/journal.pone.0087340. eCollection 2014. PLoS One. 2014. PMID: 24498312 Free PMC article.
-
Is interferon-gamma the right marker for bacille Calmette-Guérin-induced immune protection? The missing link in our understanding of tuberculosis immunology.Clin Exp Immunol. 2012 Sep;169(3):213-9. doi: 10.1111/j.1365-2249.2012.04614.x. Clin Exp Immunol. 2012. PMID: 22861360 Free PMC article. Review.
-
The immune response to BCG vaccination of newborns.Ann N Y Acad Sci. 2005 Dec;1062:69-78. doi: 10.1196/annals.1358.010. Ann N Y Acad Sci. 2005. PMID: 16461790 Review.
Cited by
-
A broad profile of co-dominant epitopes shapes the peripheral Mycobacterium tuberculosis specific CD8+ T-cell immune response in South African patients with active tuberculosis.PLoS One. 2013;8(3):e58309. doi: 10.1371/journal.pone.0058309. Epub 2013 Mar 26. PLoS One. 2013. PMID: 23555576 Free PMC article. Clinical Trial.
-
Single-Cell Transcriptome Analysis of H5N1-HA-Stimulated Alpaca PBMCs.Biomolecules. 2022 Dec 28;13(1):60. doi: 10.3390/biom13010060. Biomolecules. 2022. PMID: 36671445 Free PMC article.
-
Induction and maintenance of a phenotypically heterogeneous lung tissue-resident CD4+ T cell population following BCG immunisation.Vaccine. 2018 Sep 5;36(37):5625-5635. doi: 10.1016/j.vaccine.2018.07.035. Epub 2018 Aug 7. Vaccine. 2018. PMID: 30097220 Free PMC article.
-
CD4+ T-cell responses among adults and young children in response to Streptococcus pneumoniae and Haemophilus influenzae vaccine candidate protein antigens.Vaccine. 2013 Jun 26;31(30):3090-7. doi: 10.1016/j.vaccine.2013.03.060. Epub 2013 Apr 28. Vaccine. 2013. PMID: 23632305 Free PMC article.
-
Functional, Antigen-Specific Stem Cell Memory (TSCM) CD4+ T Cells Are Induced by Human Mycobacterium tuberculosis Infection.Front Immunol. 2018 Mar 1;9:324. doi: 10.3389/fimmu.2018.00324. eCollection 2018. Front Immunol. 2018. PMID: 29545791 Free PMC article. Clinical Trial.
References
-
- Nelson LJ, Wells CD. Global epidemiology of childhood tuberculosis. Int J Tuberc Lung Dis 2004;8:636–647. - PubMed
-
- Lienhardt C, Sillah J, Fielding K, Donkor S, Manneh K, Warndorff D, Bennett S, McAdam K. Risk factors for tuberculosis infection in children in contact with infectious tuberculosis cases in the Gambia, West Africa. Pediatrics 2003;111:e608–e614. - PubMed
-
- Elenga N, Kouakoussui KA, Bonard D, Fassinou P, Anaky MF, Wemin ML, Dick-Amon-Tanoh F, Rouet F, Vincent V, Msellati P. Diagnosed tuberculosis during the follow-up of a cohort of human immunodeficiency virus-infected children in Abidjan, Cote d'Ivoire: ANRS 1278 study. Pediatr Infect Dis J 2005;24:1077–1082. - PubMed
-
- Madhi SA, Huebner RE, Doedens L, Aduc T, Wesley D, Cooper PA. HIV-1 co-infection in children hospitalised with tuberculosis in South Africa. Int J Tuberc Lung Dis 2000;4:448–454. - PubMed
Publication types
MeSH terms
Substances
Grants and funding
LinkOut - more resources
Full Text Sources
Other Literature Sources
Medical
Research Materials

