

Key residues on microtubule responsible for activation of kinesin ATPase
- PMID: 20224548
- PMCID: PMC2857467
- DOI: 10.1038/emboj.2010.25
Key residues on microtubule responsible for activation of kinesin ATPase
Abstract
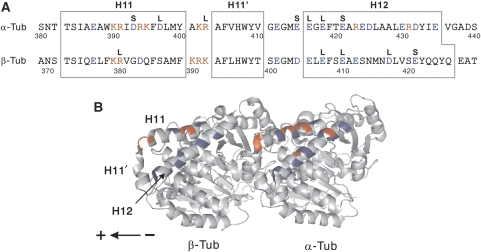
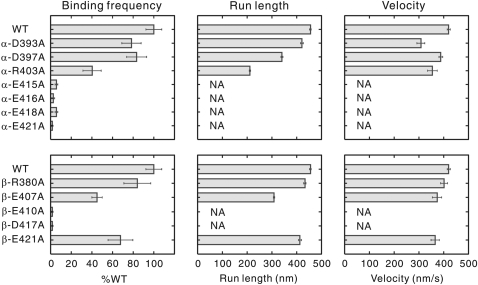
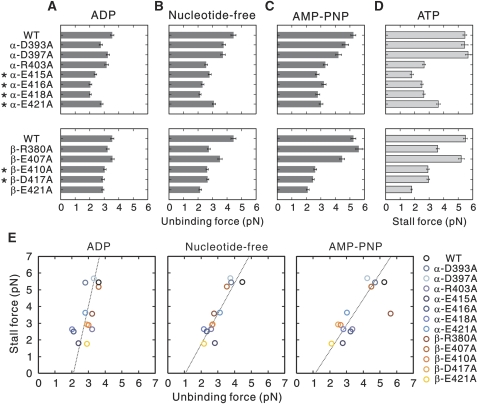
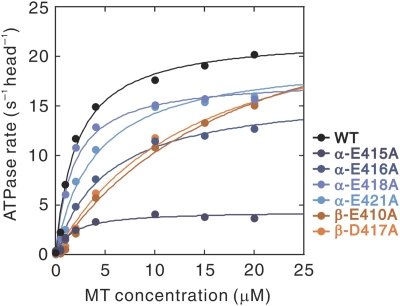
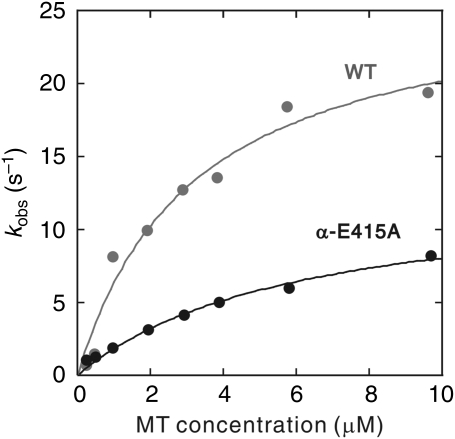
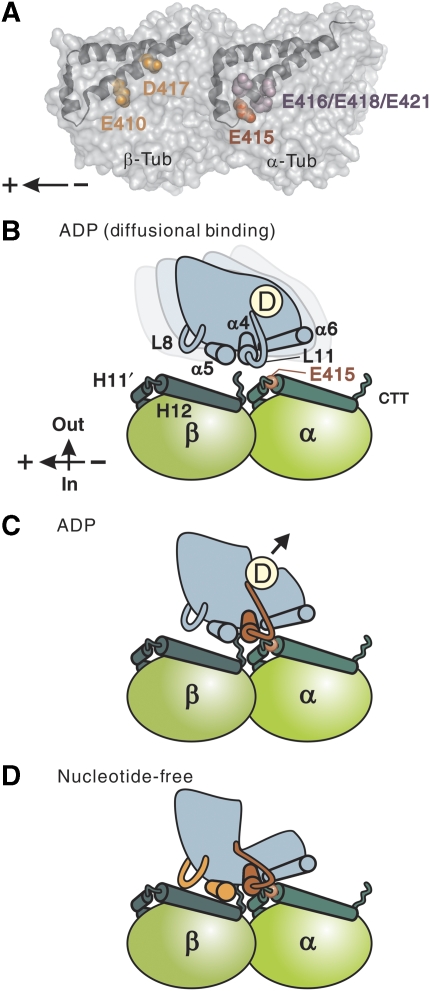
Microtubule (MT) binding accelerates the rate of ATP hydrolysis in kinesin. To understand the underlying mechanism, using charged-to-alanine mutational analysis, we identified two independent sites in tubulin, which are critical for kinesin motility, namely, a cluster of negatively charged residues spanning the helix 11-12 (H11-12) loop and H12 of alpha-tubulin, and the negatively charged residues in H12 of beta-tubulin. Mutation in the alpha-tubulin-binding site results in a deceleration of ATP hydrolysis (k(cat)), whereas mutation in the beta-tubulin-binding site lowers the affinity for MTs (K(0.5)MT). The residue E415 in alpha-tubulin seems to be important for coupling MT binding and ATPase activation, because the mutation at this site results in a drastic reduction in the overall rate of ATP hydrolysis, largely due to a deceleration in the reaction of ADP release. Our results suggest that kinesin binding at a region containing alpha-E415 could transmit a signal to the kinesin nucleotide pocket, triggering its conformational change and leading to the release of ADP.
Conflict of interest statement
The authors declare that they have no conflict of interest.
Figures
Similar articles
-
New Insights into the Coupling between Microtubule Depolymerization and ATP Hydrolysis by Kinesin-13 Protein Kif2C.J Biol Chem. 2015 Jul 24;290(30):18721-31. doi: 10.1074/jbc.M115.646919. Epub 2015 Jun 8. J Biol Chem. 2015. PMID: 26055718 Free PMC article.
-
Identification of a strong binding site for kinesin on the microtubule using mutant analysis of tubulin.EMBO J. 2006 Dec 13;25(24):5932-41. doi: 10.1038/sj.emboj.7601442. Epub 2006 Nov 23. EMBO J. 2006. PMID: 17124495 Free PMC article.
-
The yeast kinesin-5 Cin8 interacts with the microtubule in a noncanonical manner.J Biol Chem. 2017 Sep 1;292(35):14680-14694. doi: 10.1074/jbc.M117.797662. Epub 2017 Jul 12. J Biol Chem. 2017. PMID: 28701465 Free PMC article.
-
Engineering tubulin: microtubule functionalization approaches for nanoscale device applications.Appl Microbiol Biotechnol. 2011 Apr;90(1):1-10. doi: 10.1007/s00253-011-3140-7. Epub 2011 Feb 16. Appl Microbiol Biotechnol. 2011. PMID: 21327409 Free PMC article. Review.
-
Motile systems: Tubulin-based motility races ahead.Curr Biol. 1995 Dec 1;5(12):1354-6. doi: 10.1016/s0960-9822(95)00268-5. Curr Biol. 1995. PMID: 8749383 Review. No abstract available.
Cited by
-
Disease-associated mutations in TUBA1A result in a spectrum of defects in the tubulin folding and heterodimer assembly pathway.Hum Mol Genet. 2010 Sep 15;19(18):3599-613. doi: 10.1093/hmg/ddq276. Epub 2010 Jul 5. Hum Mol Genet. 2010. PMID: 20603323 Free PMC article.
-
Molecular switch-like regulation in motor proteins.Philos Trans R Soc Lond B Biol Sci. 2018 Jun 19;373(1749):20170181. doi: 10.1098/rstb.2017.0181. Philos Trans R Soc Lond B Biol Sci. 2018. PMID: 29735735 Free PMC article. Review.
-
Native kinesin-1 does not bind preferentially to GTP-tubulin-rich microtubules in vitro.Cytoskeleton (Hoboken). 2017 Sep;74(9):356-366. doi: 10.1002/cm.21386. Epub 2017 Jul 24. Cytoskeleton (Hoboken). 2017. PMID: 28699205 Free PMC article.
-
Near-atomic cryo-EM structure of PRC1 bound to the microtubule.Proc Natl Acad Sci U S A. 2016 Aug 23;113(34):9430-9. doi: 10.1073/pnas.1609903113. Epub 2016 Aug 4. Proc Natl Acad Sci U S A. 2016. PMID: 27493215 Free PMC article.
-
Phenotypic spectrum of the tubulin-related disorders and functional implications of disease-causing mutations.Curr Opin Genet Dev. 2011 Jun;21(3):286-94. doi: 10.1016/j.gde.2011.01.003. Epub 2011 Feb 1. Curr Opin Genet Dev. 2011. PMID: 21292473 Free PMC article. Review.
References
-
- Bloom GS, Wagner MC, Pfister KK, Brady ST (1988) Native structure and physical properties of bovine brain kinesin and identification of the ATP-binding subunit polypeptide. Biochemistry 27: 3409–3416 - PubMed
-
- Carter NJ, Cross RA (2005) Mechanics of the kinesin step. Nature 435: 308–312 - PubMed
-
- Crevel IM, Lockhart A, Cross RA (1996) Weak and strong states of kinesin and ncd. J Mol Biol 257: 66–76 - PubMed
-
- Cross RA (2004) The kinetic mechanism of kinesin. Trends Biochem Sci 29: 301–309 - PubMed
Publication types
MeSH terms
Substances
LinkOut - more resources
Full Text Sources
Molecular Biology Databases
Miscellaneous
