

E2F-1 has dual roles depending on the cell cycle
- PMID: 20224733
- PMCID: PMC2836542
- DOI: 10.7150/ijbs.6.116
E2F-1 has dual roles depending on the cell cycle
Abstract
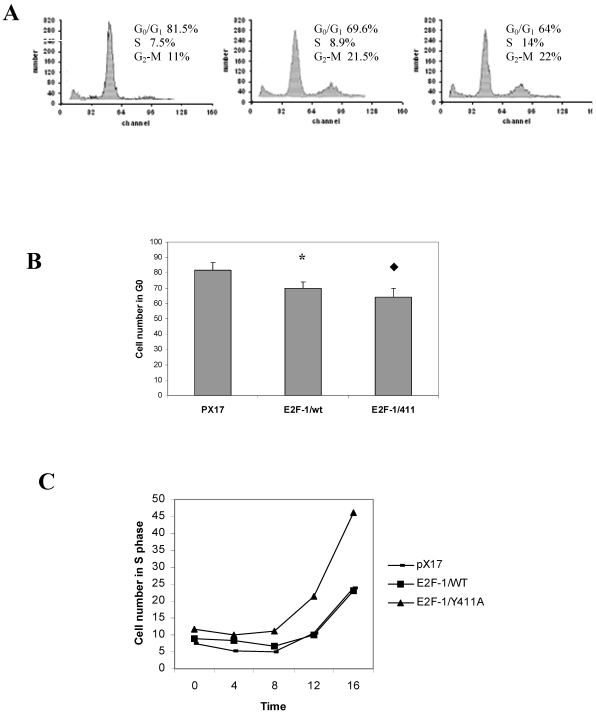
The E2F family of transcription factors play a critical role in the control of cell proliferation. E2F-1 is the major cellular target of pRB and is regulated by pRB during cell proliferation. E2F-1-mediated activation and repression of target genes occurs in different settings. The role of E2F-1 and E2F-1/pRB complexes in regulation of different target genes, and in cycling versus quiescent cells, is unclear. In this study, effects of free E2F-1 (doesn't complex with pRb) and E2F-1/pRb complex, on E2F-1 target gene expression were compared in different cell growth conditions. Findings suggest that E2F-1 acts in different ways, not only depending on the target gene but also depending on different stages of the cell cycle. For example, E2F-1 acts as part of the repression complex with pRB in the expression of DHFR, b-myb, TK and cdc2 in asynchronously growing cells; on the other hand, E2F-1 acts as an activator in the expression of the same genes in cells that are re-entering the cycle.
Keywords: Cell cycle; E2F-1; Rb; TK; cdc2; cmyc; dhfr.
Conflict of interest statement
Conflict of Interest: There are no conflicts of interest and financial disclosure in the subject matter of this paper.
Figures


Similar articles
-
E2F-1 binding affinity for pRb is not the only determinant of the E2F-1 activity.Int J Biol Sci. 2010 Jul 4;6(4):382-95. doi: 10.7150/ijbs.6.382. Int J Biol Sci. 2010. PMID: 20616879 Free PMC article.
-
Unique roles for E2F1 in the mouse lens in the absence of functional pRB proteins.Invest Ophthalmol Vis Sci. 2002 May;43(5):1509-16. Invest Ophthalmol Vis Sci. 2002. PMID: 11980867
-
The E2F-family proteins induce distinct cell cycle regulatory factors in p16-arrested, U343 astrocytoma cells.Oncogene. 1998 Aug 20;17(7):867-76. doi: 10.1038/sj.onc.1202008. Oncogene. 1998. PMID: 9780003
-
TGFbeta-mediated formation of pRb-E2F complexes in human myeloid leukemia cells.Biochem Biophys Res Commun. 2008 May 2;369(2):277-80. doi: 10.1016/j.bbrc.2008.02.051. Epub 2008 Feb 21. Biochem Biophys Res Commun. 2008. PMID: 18294958 Review.
-
pRb-E2F signaling in life of mesenchymal stem cells: Cell cycle, cell fate, and cell differentiation.Genes Dis. 2014 Sep 30;1(2):174-187. doi: 10.1016/j.gendis.2014.09.007. eCollection 2014 Dec. Genes Dis. 2014. PMID: 30258863 Free PMC article. Review.
Cited by
-
Comparative transcriptional network modeling of three PPAR-α/γ co-agonists reveals distinct metabolic gene signatures in primary human hepatocytes.PLoS One. 2012;7(4):e35012. doi: 10.1371/journal.pone.0035012. Epub 2012 Apr 13. PLoS One. 2012. PMID: 22514701 Free PMC article.
-
Five novel RB1 gene mutations and genotype-phenotype correlations in Chinese children with retinoblastoma.Int Ophthalmol. 2022 Nov;42(11):3421-3430. doi: 10.1007/s10792-022-02341-2. Epub 2022 Aug 12. Int Ophthalmol. 2022. PMID: 35960463 Free PMC article.
-
Regulation of cellular miRNA expression by human papillomaviruses.Biochim Biophys Acta. 2011 Nov-Dec;1809(11-12):668-77. doi: 10.1016/j.bbagrm.2011.05.005. Epub 2011 May 17. Biochim Biophys Acta. 2011. PMID: 21616186 Free PMC article. Review.
-
NEDDylation regulates E2F-1-dependent transcription.EMBO Rep. 2012 Sep;13(9):811-8. doi: 10.1038/embor.2012.113. Epub 2012 Jul 27. EMBO Rep. 2012. PMID: 22836579 Free PMC article.
-
Identification of genes differentially expressed in myogenin knock-down bovine muscle satellite cells during differentiation through RNA sequencing analysis.PLoS One. 2014 Mar 19;9(3):e92447. doi: 10.1371/journal.pone.0092447. eCollection 2014. PLoS One. 2014. PMID: 24647404 Free PMC article.
References
-
- Johnson DG, Ohtani K, Nevins JR. Autoregulatory control of E2F1 expression in response to positive and negative regulators of cell cycle progression. Genes Dev. 1994;8:1514–1525. - PubMed
-
- Sherr CJ. The Pezcoller lecture: cancer cell cycles revisited. Cancer Res. 2000;60:3689–3695. - PubMed
-
- Dyson N. The regulation of E2F by pRB-family proteins. Genes Dev. 1998;12:2245–2262. - PubMed
MeSH terms
Substances
LinkOut - more resources
Full Text Sources
Molecular Biology Databases
Miscellaneous
