

Human mammary epithelial cells exhibit a bimodal correlated random walk pattern
- PMID: 20224792
- PMCID: PMC2835765
- DOI: 10.1371/journal.pone.0009636
Human mammary epithelial cells exhibit a bimodal correlated random walk pattern
Abstract
Background: Organisms, at scales ranging from unicellular to mammals, have been known to exhibit foraging behavior described by random walks whose segments confirm to Lévy or exponential distributions. For the first time, we present evidence that single cells (mammary epithelial cells) that exist in multi-cellular organisms (humans) follow a bimodal correlated random walk (BCRW).
Methodology/principal findings: Cellular tracks of MCF-10A pBabe, neuN and neuT random migration on 2-D plastic substrates, analyzed using bimodal analysis, were found to reveal the BCRW pattern. We find two types of exponentially distributed correlated flights (corresponding to what we refer to as the directional and re-orientation phases) each having its own correlation between move step-lengths within flights. The exponential distribution of flight lengths was confirmed using different analysis methods (logarithmic binning with normalization, survival frequency plots and maximum likelihood estimation).
Conclusions/significance: Because of the presence of non-uniform turn angle distribution of move step-lengths within a flight and two different types of flights, we propose that the epithelial random walk is a BCRW comprising of two alternating modes with varying degree of correlations, rather than a simple persistent random walk. A BCRW model rather than a simple persistent random walk correctly matches the super-diffusivity in the cell migration paths as indicated by simulations based on the BCRW model.
Conflict of interest statement
Figures
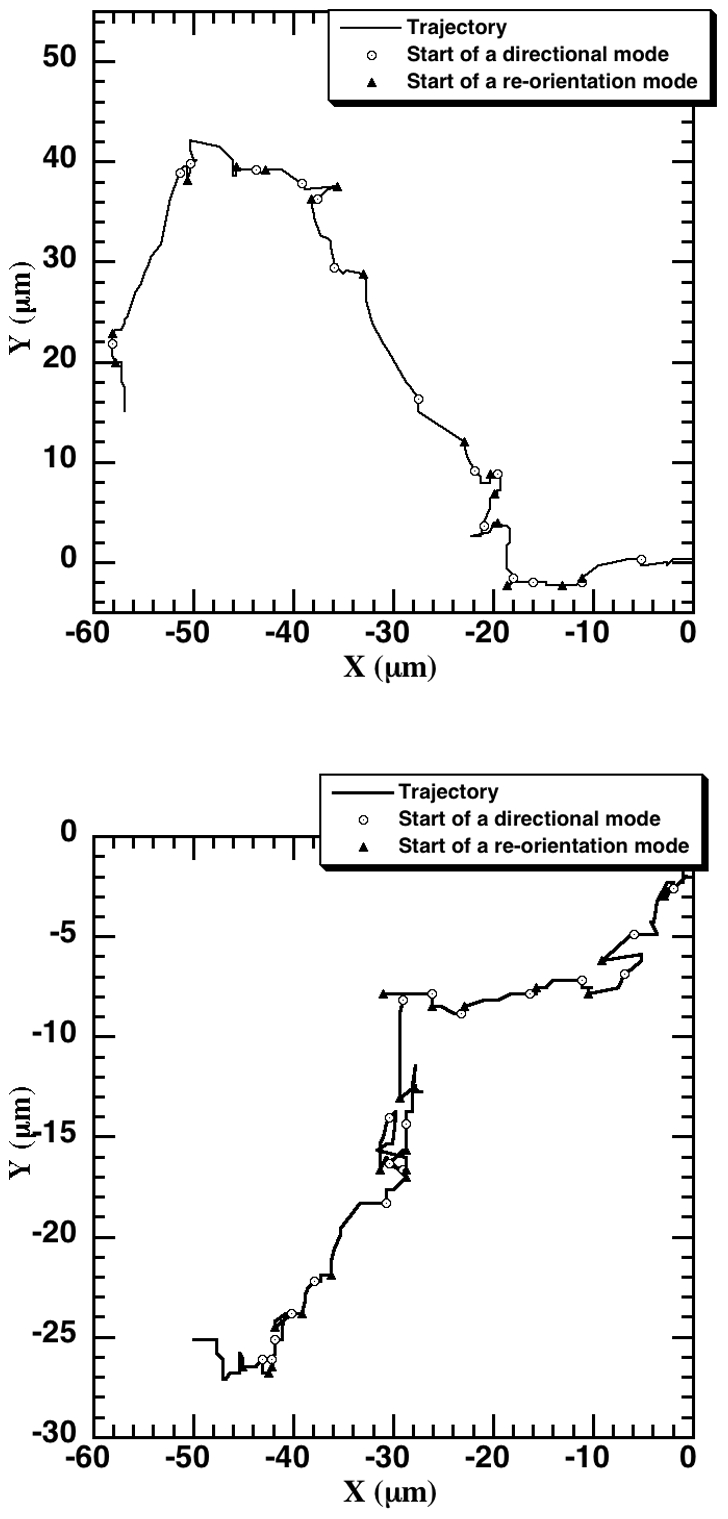
 ) and re-orientation (
 ) phases for the three cell types (pBabe (
 = 15), neuN (
 = 15), neuT (
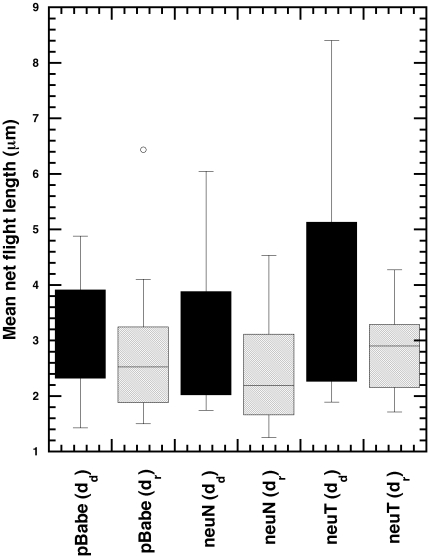
 = 12)). The distance traversed in directional flights is more than during re-orientation flights (statistical analysis in Table 1).
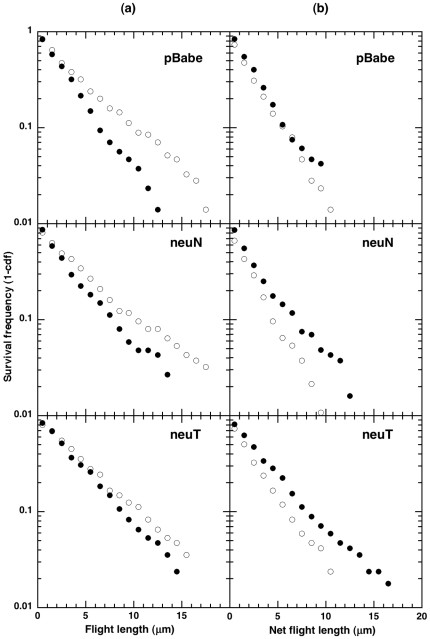
 for exponential distribution) along with statistical analysis are shown in Table 2.
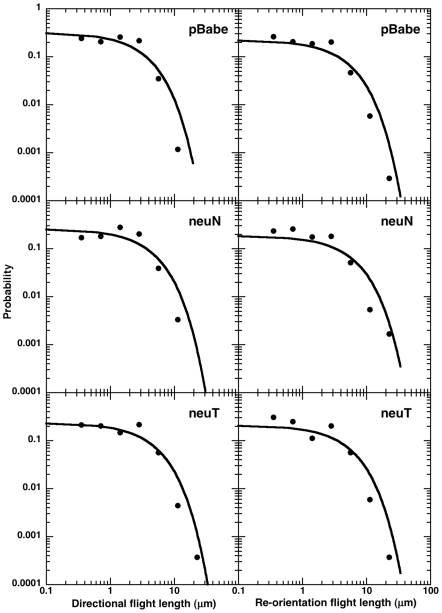
 (obtained from corresponding survival distribution) is shown in bold curve in black. The fitted exponential distribution is in good agreement with the experimental data points.
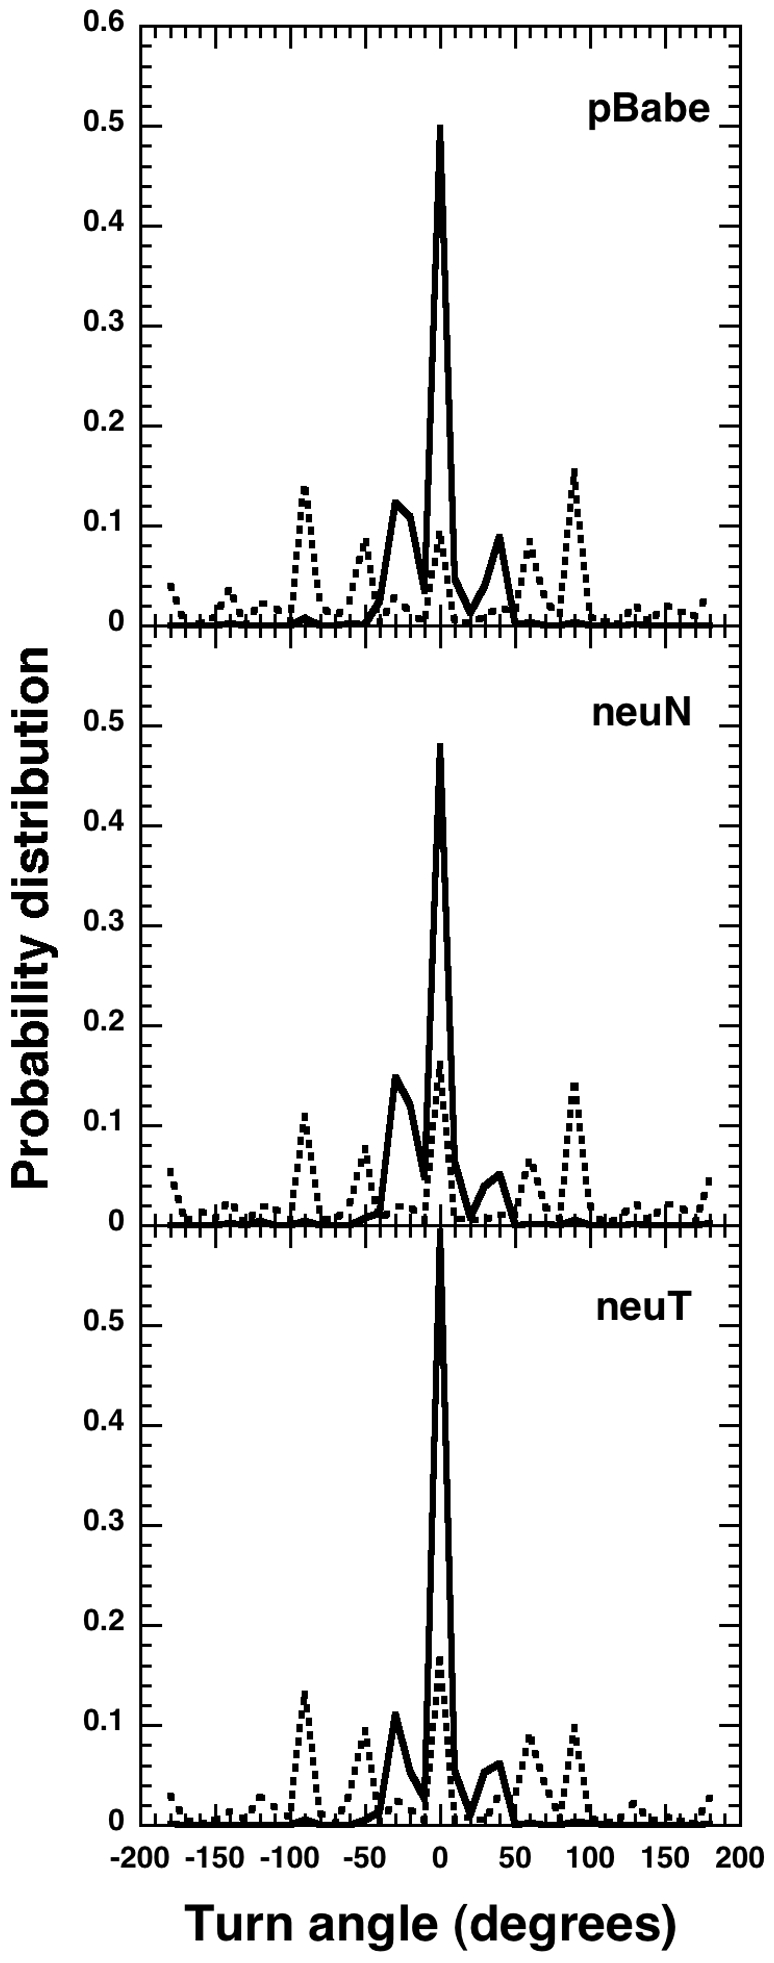
References
-
- Bray D. Cell movements: from molecules to motility. NY: Garland Publishing.; 2001. 372
-
- Chambers AF, Groom AC, MacDonald IC. Dissemination and growth of cancer cells in metastatic sites. Nature Reviews Cancer. 2002;2:563–572. - PubMed
-
- Le Douarin NM. Cell migrations in embryos. Cell. 1984;38:353–360. - PubMed
-
- Luster AD, Alon R, von Andrian UH. Immune cell migration in inflammation: present and future therapeutic targets. Nature Immunology. 2005;6:1182–1190. - PubMed
-
- Berg HC. Random Walks in Biology. Princeton: Princeton University Press.; 1983. 164
Publication types
MeSH terms
Grants and funding
LinkOut - more resources
Full Text Sources
Molecular Biology Databases
