

Phenotypic and Genotypic Antimicrobial Resistance Profiles of Campylobacter jejuni Isolated from Cattle, Sheep, and Free-Range Poultry Faeces
- PMID: 20224816
- PMCID: PMC2834959
- DOI: 10.1155/2009/456573
Phenotypic and Genotypic Antimicrobial Resistance Profiles of Campylobacter jejuni Isolated from Cattle, Sheep, and Free-Range Poultry Faeces
Abstract
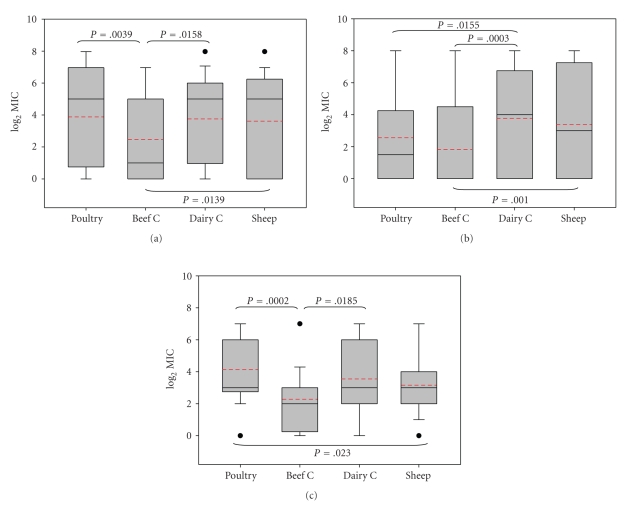
Minimum inhibitory concentrations (MIC) of 13 antimicrobial agents were determined by broth microdilution for 72 Campylobacter jejuni strains from livestock. Twenty-three (31.9%) isolates were fully susceptible; all isolates were susceptible to erythromycin, chloramphenicol, streptomycin, gentamicin, sulfamethoxazole, and meropenem, and all but one to kanamycin. Resistance to quinolones was highest (52.8%), reaching similar values among poultry, dairy cattle, and sheep, but lower in beef cattle. Resistance to tetracyclines (48.6%) was mainly associated to dairy cattle and beta-lactams (26.4%) to poultry. Multidrug resistance was mainly detected in dairy cattle (28.6%) and poultry (21.0%), whereas beef cattle had the highest percentage of fully susceptible isolates. Two real-time PCR assays to detect point mutations associated to quinolone (C257T in the gyrA gene) and macrolide (A2075G in the 23S rRNA genes) resistance were developed and validated on these strains. The analysis of a further set of 88 isolates by real-time PCR confirmed the absence of macrolide resistance and demonstrated the reproducibility and processability of the assay.
Figures
Similar articles
-
Antimicrobial Resistance of Campylobacter Species Isolated from Broilers in Live Bird Markets in Shanghai, China.Foodborne Pathog Dis. 2017 Feb;14(2):96-102. doi: 10.1089/fpd.2016.2186. Epub 2016 Nov 17. Foodborne Pathog Dis. 2017. PMID: 27854542
-
Macrolide resistance in Campylobacter jejuni and Campylobacter coli: molecular mechanism and stability of the resistance phenotype.Antimicrob Agents Chemother. 2005 Jul;49(7):2753-9. doi: 10.1128/AAC.49.7.2753-2759.2005. Antimicrob Agents Chemother. 2005. PMID: 15980346 Free PMC article.
-
Phenotypic and Genotypic Examination of Antimicrobial Resistance in Thermophilic Campylobacter Species Isolated from Poultry in Turkey.J Vet Res. 2018 Dec 31;62(4):463-468. doi: 10.2478/jvetres-2018-0071. eCollection 2018 Dec. J Vet Res. 2018. PMID: 30729203 Free PMC article.
-
Characterization of Campylobacter jejuni and Campylobacter coli Broiler Isolates by Whole-Genome Sequencing.Foodborne Pathog Dis. 2018 Mar;15(3):145-152. doi: 10.1089/fpd.2017.2325. Epub 2017 Dec 19. Foodborne Pathog Dis. 2018. PMID: 29256637
-
Determination of antimicrobial sensitivities of Campylobacter jejuni isolated from commercial turkey farms in Germany.Avian Dis. 2012 Dec;56(4):685-92. doi: 10.1637/10135-031912-Reg.1. Avian Dis. 2012. PMID: 23397839
Cited by
-
A One Health approach for the genomic characterization of antibiotic-resistant Campylobacter isolates using Nanopore whole-genome sequencing.Front Microbiol. 2025 Jan 29;16:1540210. doi: 10.3389/fmicb.2025.1540210. eCollection 2025. Front Microbiol. 2025. PMID: 39980694 Free PMC article.
-
Identification of a novel G2073A mutation in 23S rRNA in amphenicol-selected mutants of Campylobacter jejuni.PLoS One. 2014 Apr 11;9(4):e94503. doi: 10.1371/journal.pone.0094503. eCollection 2014. PLoS One. 2014. PMID: 24728007 Free PMC article.
-
Genotypes, Antibiotic Resistance, and ST-8 Genetic Clone in Campylobacter Isolates from Sheep and Goats in Grenada.Vet Med Int. 2014;2014:212864. doi: 10.1155/2014/212864. Epub 2014 Feb 11. Vet Med Int. 2014. PMID: 24693459 Free PMC article.
-
Multilocus Sequence Typing and Antimicrobial Resistance of Campylobacter jejuni Isolated from Dairy Calves in Austria.Front Microbiol. 2016 Feb 3;7:72. doi: 10.3389/fmicb.2016.00072. eCollection 2016. Front Microbiol. 2016. PMID: 26870027 Free PMC article.
-
Pharmacokinetics of oral chlortetracycline in nonpregnant adult ewes.J Vet Pharmacol Ther. 2014 Dec;37(6):607-10. doi: 10.1111/jvp.12144. Epub 2014 Jul 31. J Vet Pharmacol Ther. 2014. PMID: 25131164 Free PMC article.
References
-
- Allos BM. Campylobacter jejuni infections: update on emerging issues and trends. Clinical Infectious Diseases. 2001;32(8):1201–1206. - PubMed
-
- EFSA. The community summary report on trends and sources of zoonoses, zoonotic agents, antimicrobial resistance and foodborne outbreaks in the European Union in 2006. The EFSA Journal. 2007;130
-
- Nelson JM, Smith KE, Vugia DJ, et al. Prolonged diarrhea due to ciprofloxacin-resistant Campylobacter infection. Journal of Infectious Diseases. 2004;190(6):1150–1157. - PubMed
-
- van den Bogaard AE, Stobberingh EE. Epidemiology of resistance to antibiotics: links between animals and humans. International Journal of Antimicrobial Agents. 2000;14(4):327–335. - PubMed
LinkOut - more resources
Full Text Sources
