

Transcriptomic analysis of starch biosynthesis in the developing grain of hexaploid wheat
- PMID: 20224818
- PMCID: PMC2834961
- DOI: 10.1155/2009/407426
Transcriptomic analysis of starch biosynthesis in the developing grain of hexaploid wheat
Abstract
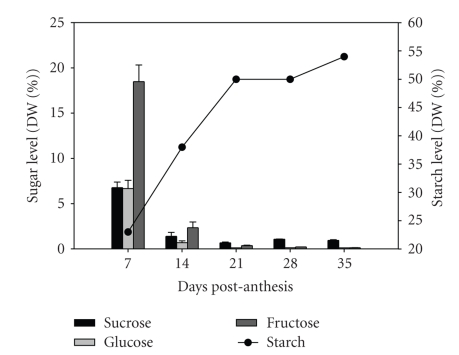
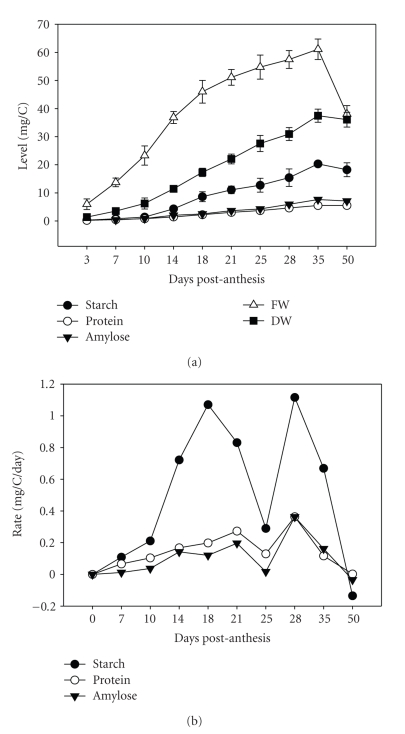
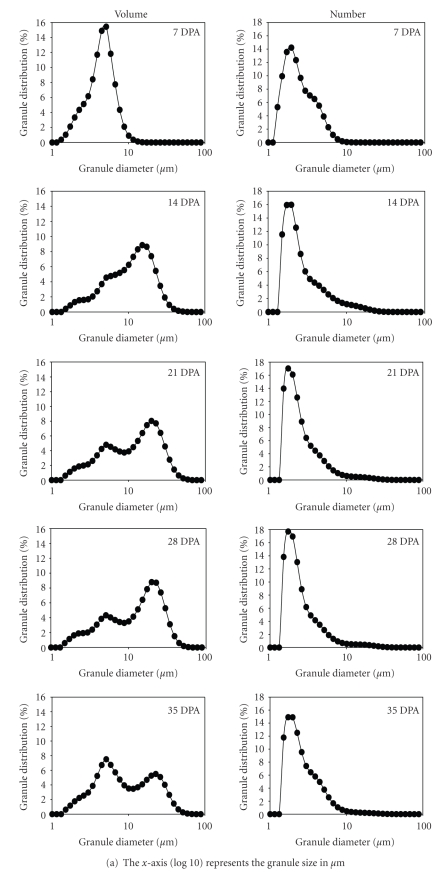
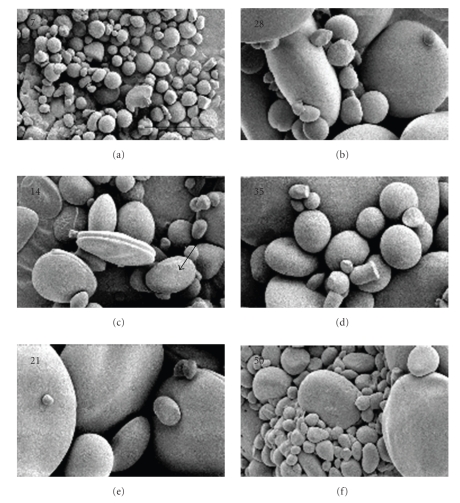
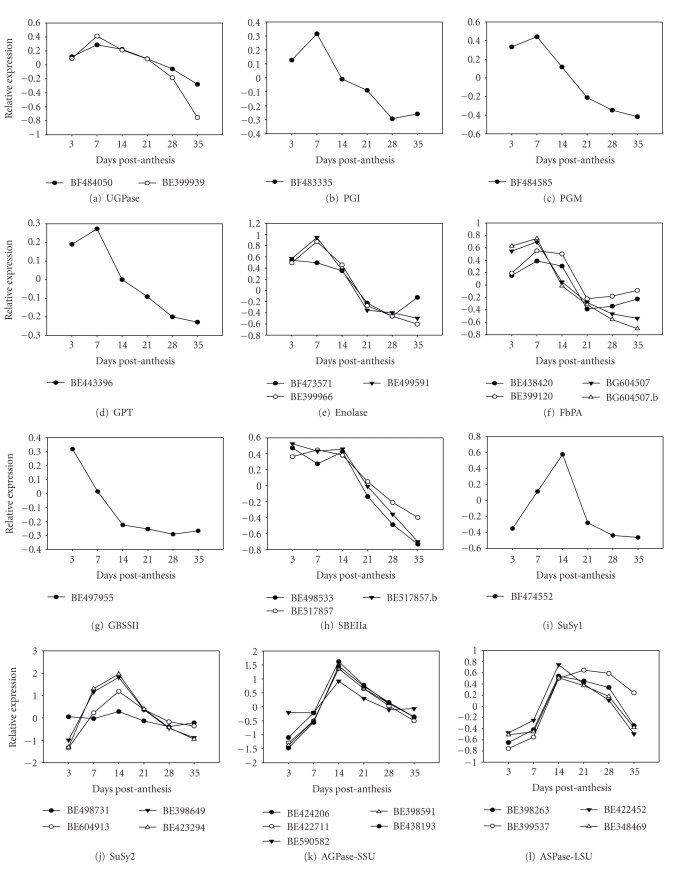
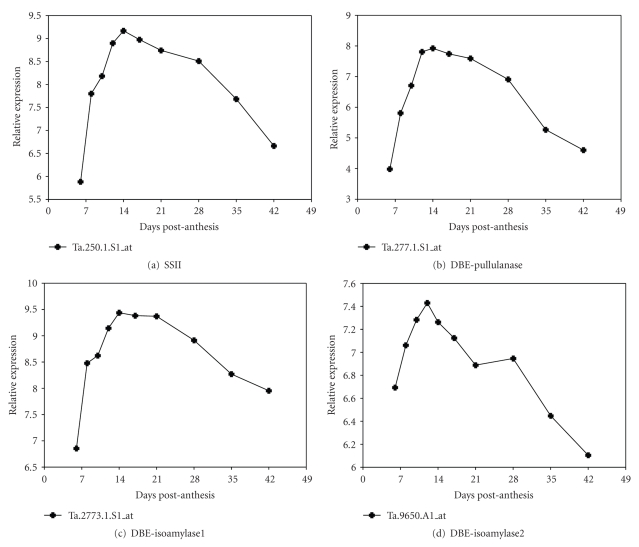
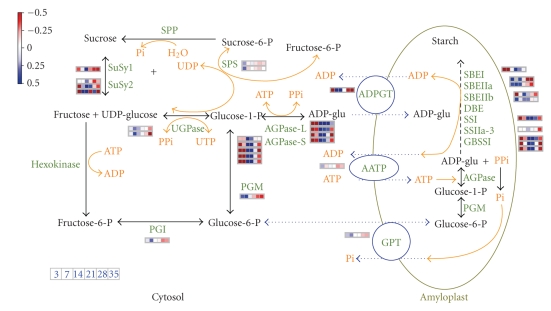
The expression of genes involved in starch synthesis in wheat was analyzed together with the accumulation profiles of soluble sugars, starch, protein, and starch granule distribution in developing caryopses obtained from the same biological materials used for profiling of gene expression using DNA microarrays. Multiple expression patterns were detected for the different starch biosynthetic gene isoforms, suggesting their relative importance through caryopsis development. Members of the ADP-glucose pyrophosphorylase, starch synthase, starch branching enzyme, and sucrose synthase gene families showed different expression profiles; expression of some members of these gene families coincided with a period of high accumulation of starch while others did not. A biphasic pattern was observed in the rates of starch and protein accumulation which paralleled changes in global gene expression. Metabolic and regulatory genes that show a pattern of expression similar to starch accumulation and granule size distribution were identified, suggesting their coinvolvement in these biological processes.
Figures


Similar articles
-
[Changes in the activities of enzymes involved in starch synthesis and accumulation in caryopsis of transgenic rice with antisense Wx gene].Zhi Wu Sheng Li Yu Fen Zi Sheng Wu Xue Xue Bao. 2006 Apr;32(2):209-16. Zhi Wu Sheng Li Yu Fen Zi Sheng Wu Xue Xue Bao. 2006. PMID: 16622321 Chinese.
-
Systematic Analysis of Pericarp Starch Accumulation and Degradation during Wheat Caryopsis Development.PLoS One. 2015 Sep 22;10(9):e0138228. doi: 10.1371/journal.pone.0138228. eCollection 2015. PLoS One. 2015. PMID: 26394305 Free PMC article.
-
Transcriptomic identification and expression of starch and sucrose metabolism genes in the seeds of Chinese chestnut (Castanea mollissima).J Agric Food Chem. 2015 Jan 28;63(3):929-42. doi: 10.1021/jf505247d. Epub 2015 Jan 13. J Agric Food Chem. 2015. PMID: 25537355
-
GRAIN INCOMPLETE FILLING 2 regulates grain filling and starch synthesis during rice caryopsis development.J Integr Plant Biol. 2017 Feb;59(2):134-153. doi: 10.1111/jipb.12510. J Integr Plant Biol. 2017. PMID: 27957808
-
Reappraisal of the currently prevailing model of starch biosynthesis in photosynthetic tissues: a proposal involving the cytosolic production of ADP-glucose by sucrose synthase and occurrence of cyclic turnover of starch in the chloroplast.Plant Cell Physiol. 2001 Dec;42(12):1311-20. doi: 10.1093/pcp/pce175. Plant Cell Physiol. 2001. PMID: 11773523 Review.
Cited by
-
Evolutionary, structural and expression analysis of core genes involved in starch synthesis.Sci Rep. 2018 Aug 24;8(1):12736. doi: 10.1038/s41598-018-30411-y. Sci Rep. 2018. PMID: 30143668 Free PMC article.
-
In vitro Biochemical Characterization of All Barley Endosperm Starch Synthases.Front Plant Sci. 2016 Jan 28;6:1265. doi: 10.3389/fpls.2015.01265. eCollection 2015. Front Plant Sci. 2016. PMID: 26858729 Free PMC article.
-
Molecular Functions and Pathways of Plastidial Starch Phosphorylase (PHO1) in Starch Metabolism: Current and Future Perspectives.Int J Mol Sci. 2021 Sep 28;22(19):10450. doi: 10.3390/ijms221910450. Int J Mol Sci. 2021. PMID: 34638789 Free PMC article. Review.
-
Final grain weight is not limited by the activity of key starch-synthesising enzymes during grain filling in wheat.J Exp Bot. 2018 Nov 26;69(22):5461-5475. doi: 10.1093/jxb/ery314. J Exp Bot. 2018. PMID: 30165455 Free PMC article.
-
Crop resistant starch and genetic improvement: a review of recent advances.Theor Appl Genet. 2018 Dec;131(12):2495-2511. doi: 10.1007/s00122-018-3221-4. Epub 2018 Oct 29. Theor Appl Genet. 2018. PMID: 30374526 Review.
References
-
- Morrison WR, Karkalas J. Starch. In: Day PM, editor. Methods in Plant Biochemistry. San Diego, Calif, USA: Academic Press; 1990.
-
- Davis JP, Supatcharee N, Khandelwal RL, Chibbar RN. Synthesis of novel starches in planta: opportunities and challenges. Starch-Stärke. 2003;55(3-4):107–120.
-
- Wilson JD, Bechtel DB, Todd TC, Seib PA. Measurement of wheat starch granule size distribution using image analysis and laser diffraction technology. Cereal Chemistry. 2006;83(3):259–268.
-
- Hughes CE, Briarty LG. Stereological analysis of contribution made to mature wheat endosperm starch by large and small granules. Starch-Stärke. 1976;28(10):336–337.