

Metabolic crisis after traumatic brain injury is associated with a novel microdialysis proteome
- PMID: 20225002
- PMCID: PMC4347948
- DOI: 10.1007/s12028-010-9342-5
Metabolic crisis after traumatic brain injury is associated with a novel microdialysis proteome
Abstract
Background: To examine if the metabolic distress after traumatic brain injury (TBI) is associated with a unique proteome.
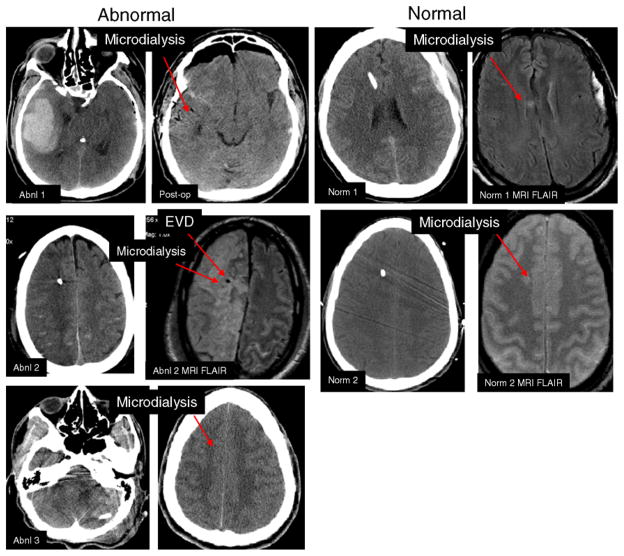
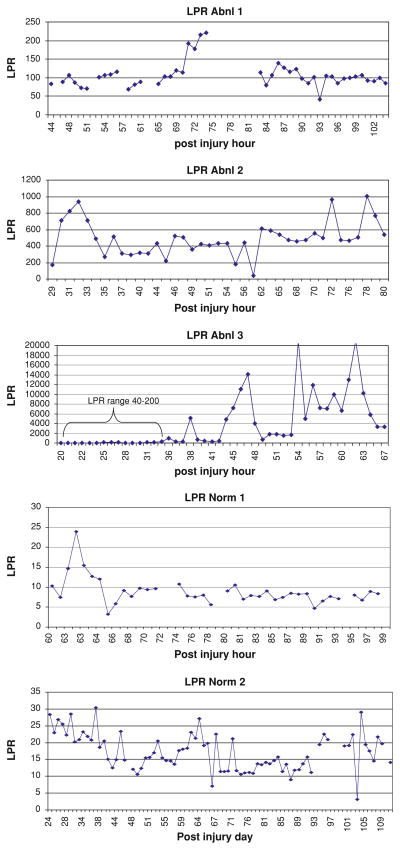
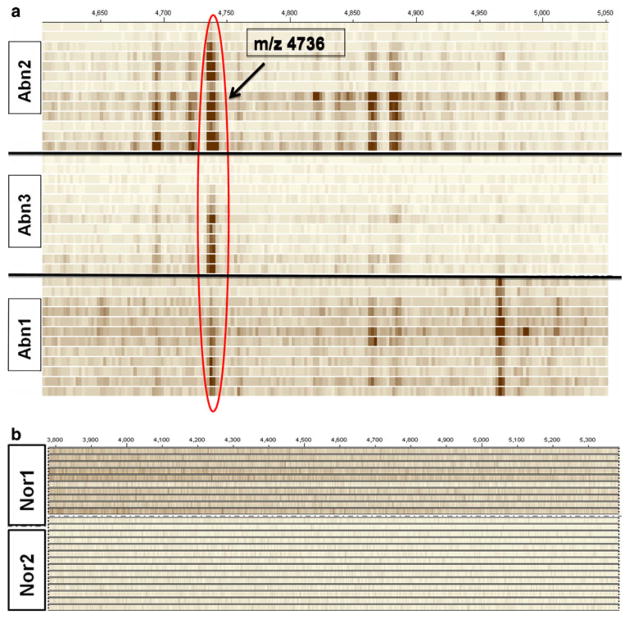
Methods: Patients with severe TBI prospectively underwent cerebral microdialysis for the initial 96 h after injury. Hourly sampling of metabolism was performed and patients were categorized as having normal or abnormal metabolism as evidenced by the lactate/pyruvate ratio (LPR) threshold of 40. The microdialysate was frozen for proteomic batch processing retrospectively. We employed two different routes of proteomic techniques utilizing mass spectrometry (MS) and categorized as diagnostic and biomarker identification approaches. The diagnostic approach was aimed at finding a signature of MS peaks which can differentiate these two groups. We did this by enriching for intact peptides followed by MALDI-MS analysis. For the biomarker identification approach, we applied classical bottom-up (trypsin digestion followed by LC-MS/MS) proteomic methodologies.
Results: Five patients were studied, 3 of whom had abnormal metabolism and 2 who had normal metabolism. By comparison, the abnormal group had higher LPR (1609 +/- 3691 vs. 15.5 +/- 6.8, P < 0.001), higher glutamate (157 +/- 84 vs. 1.8 +/- 1.4 microM, P < 0.001), and lower glucose (0.27 +/- 0.35 vs. 1.8 +/- 1.1 mmol/l, P < 0.001). The abnormal group demonstrated 13 unique proteins as compared with the normal group in the microdialysate. These proteins consisted of cytoarchitectural proteins, as well as blood breakdown proteins, and a few mitochondrial proteins. A unique as yet to be characterized peptide was found at m/z (mass/charge) 4733.5, which may represent a novel biomarker of metabolic distress.
Conclusion: Metabolic distress after TBI is associated with a differential proteome that indicates cellular destruction during the acute phase of illness. This suggests that metabolic distress has immediate cellular consequences after TBI.
Figures


Similar articles
-
Systemic glucose and brain energy metabolism after subarachnoid hemorrhage.Neurocrit Care. 2010 Jun;12(3):317-23. doi: 10.1007/s12028-009-9327-4. Neurocrit Care. 2010. PMID: 20135362
-
Normobaric hyperoxia--induced improvement in cerebral metabolism and reduction in intracranial pressure in patients with severe head injury: a prospective historical cohort-matched study.J Neurosurg. 2004 Sep;101(3):435-44. doi: 10.3171/jns.2004.101.3.0435. J Neurosurg. 2004. PMID: 15352601
-
The frontal lobe and thalamus have different sensitivities to hypoxia-hypotension after traumatic brain injury: a microdialysis study in rats.J Neurotrauma. 2012 Dec 10;29(18):2782-90. doi: 10.1089/neu.2012.2381. Epub 2012 Sep 25. J Neurotrauma. 2012. PMID: 22860603
-
Cerebral Microdialysis in Neurocritical Care.Curr Neurol Neurosci Rep. 2018 Oct 23;18(12):101. doi: 10.1007/s11910-018-0915-6. Curr Neurol Neurosci Rep. 2018. PMID: 30353361 Review.
-
Glucose metabolism following human traumatic brain injury: methods of assessment and pathophysiological findings.Metab Brain Dis. 2015 Jun;30(3):615-32. doi: 10.1007/s11011-014-9628-y. Epub 2014 Nov 21. Metab Brain Dis. 2015. PMID: 25413449 Free PMC article. Review.
Cited by
-
Bench-to-Bedside and Bedside Back to the Bench; Seeking a Better Understanding of the Acute Pathophysiological Process in Severe Traumatic Brain Injury.Front Neurol. 2015 Mar 17;6:47. doi: 10.3389/fneur.2015.00047. eCollection 2015. Front Neurol. 2015. PMID: 25852631 Free PMC article. Review.
-
Blood and CSF Biomarker Dynamics in Multiple Sclerosis: Implications for Data Interpretation.Mult Scler Int. 2011;2011:823176. doi: 10.1155/2011/823176. Epub 2011 Apr 14. Mult Scler Int. 2011. PMID: 22096644 Free PMC article.
-
Human Serum Metabolites Associate With Severity and Patient Outcomes in Traumatic Brain Injury.EBioMedicine. 2016 Oct;12:118-126. doi: 10.1016/j.ebiom.2016.07.015. Epub 2016 Jul 15. EBioMedicine. 2016. PMID: 27665050 Free PMC article.
-
"Omics" in traumatic brain injury: novel approaches to a complex disease.Acta Neurochir (Wien). 2021 Sep;163(9):2581-2594. doi: 10.1007/s00701-021-04928-7. Epub 2021 Jul 17. Acta Neurochir (Wien). 2021. PMID: 34273044 Free PMC article. Review.
-
Investigation of the levels of different salivary stress markers in chronic periodontitis patients.J Oral Biol Craniofac Res. 2020 Oct-Dec;10(4):514-518. doi: 10.1016/j.jobcr.2020.07.020. Epub 2020 Aug 12. J Oral Biol Craniofac Res. 2020. PMID: 32874881 Free PMC article.
References
-
- Marcoux J, McArthur DA, Miller C, Glenn TC, Villablanca P, Martin NA, et al. Persistent metabolic crisis as measured by elevated cerebral microdialysis lactate-pyruvate ratio predicts chronic frontal lobe brain atrophy after traumatic brain injury. Crit Care Med. 2008;36:2871–7. - PubMed
-
- Bullock R, Zauner A, Woodward JJ, Myseros J, Choi SC, Ward JD, et al. Factors affecting excitatory amino acid release following human head injury. J Neurosurg. 1998;89:507–18. - PubMed
-
- Vespa M, Prins M, Ronne-Engstrom E, Caron M, Shalmon E, Hovda DA, et al. Increase in extracellular glutamate caused by reduced cerebral perfusion presure and seizures after human traumatic brain injury: a microdialysis study. J Neurosurg. 1998;89:971–82. - PubMed
-
- Hillered L, Vespa PM, Hovda DA. Translational neurochemical research in acute human brain injury: the current status and potential future for cerebral microdialysis. J Neurotrauma. 2005;22:3–41. - PubMed
MeSH terms
Substances
Grants and funding
LinkOut - more resources
Full Text Sources
Other Literature Sources
