

Review
doi: 10.1021/cr900361p.
Peptides and peptide hormones for molecular imaging and disease diagnosis
Affiliations
- PMID: 20225899
- PMCID: PMC2868934
- DOI: 10.1021/cr900361p
Item in Clipboard
Review
Peptides and peptide hormones for molecular imaging and disease diagnosis
Chem Rev.
.
No abstract available
Figures
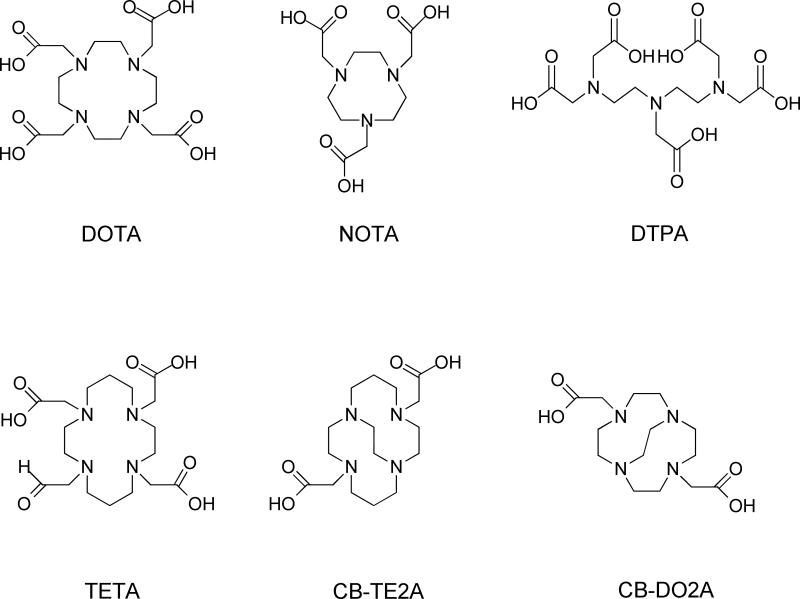
Selected macrocyclic chelators.
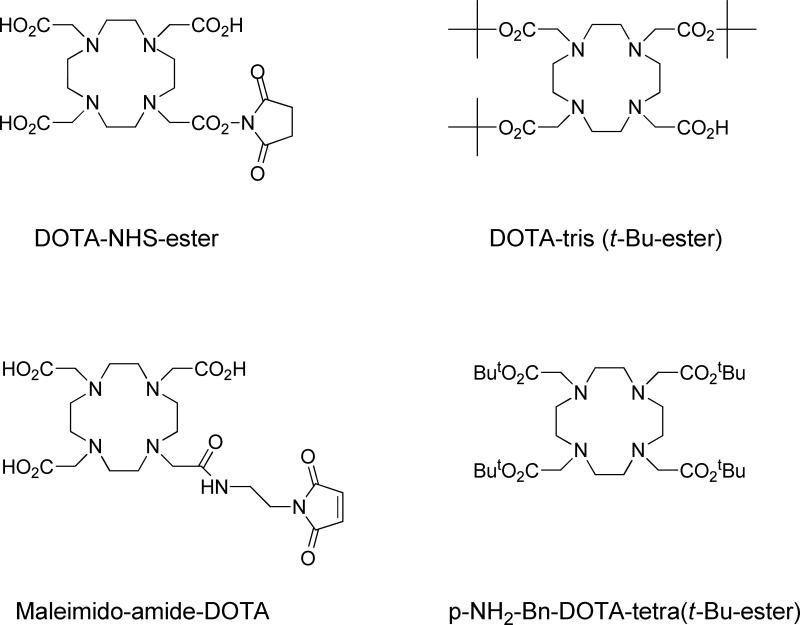
Selected bifunctional DOTA analogs.
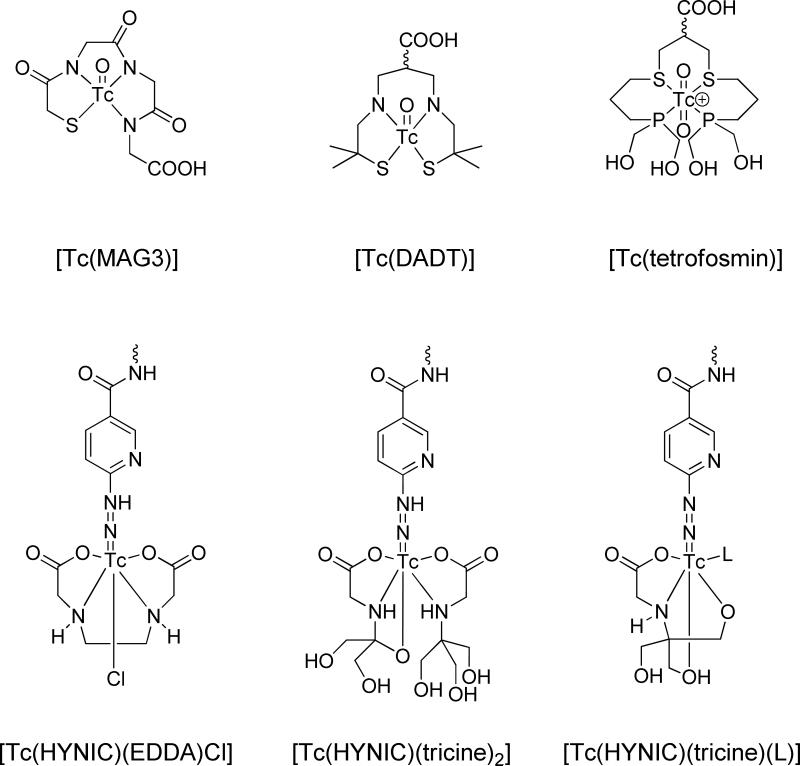
Selected chelating agents for 99mTc.
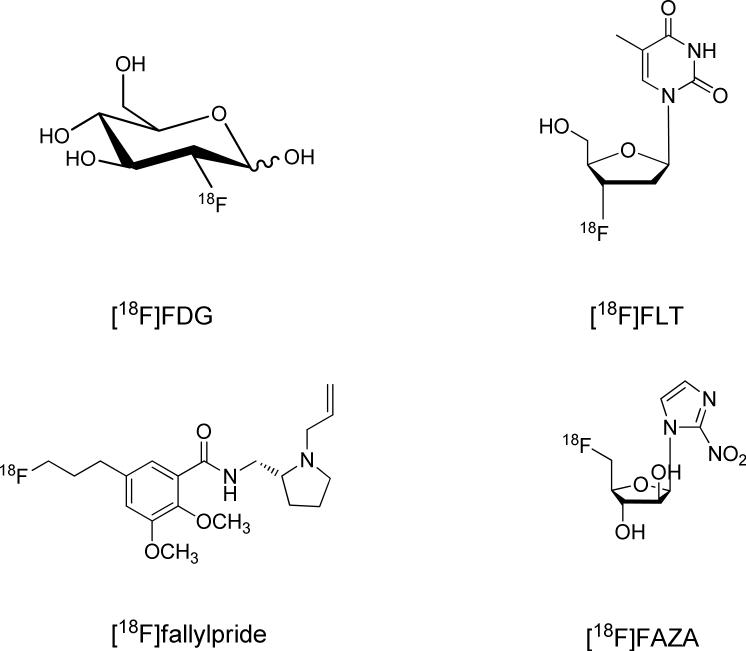
18F-labeled small molecule tracers.
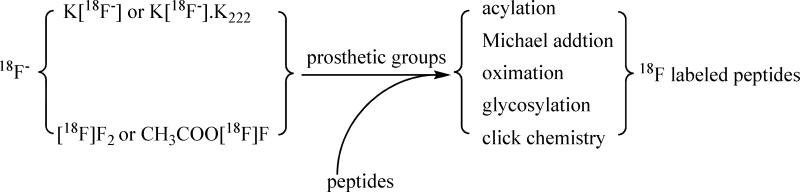
Radio-labeling of peptide with 18F.
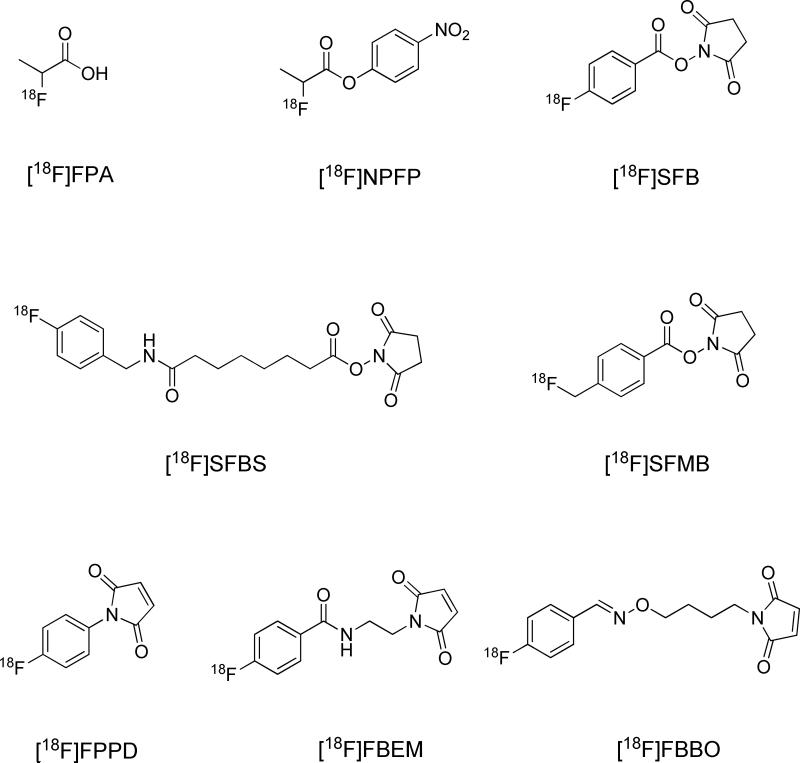
Selected 18F synthons.
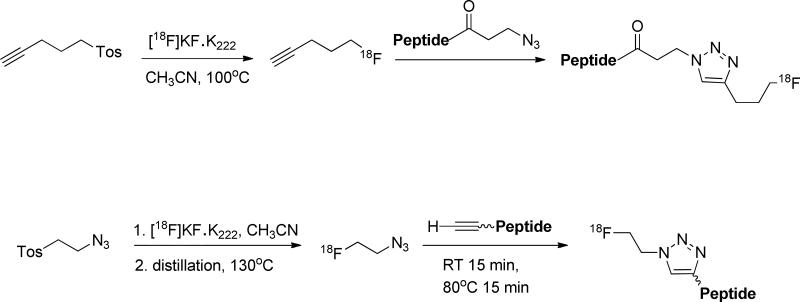
Radio-labeling of peptide with 18F via click chemistry.
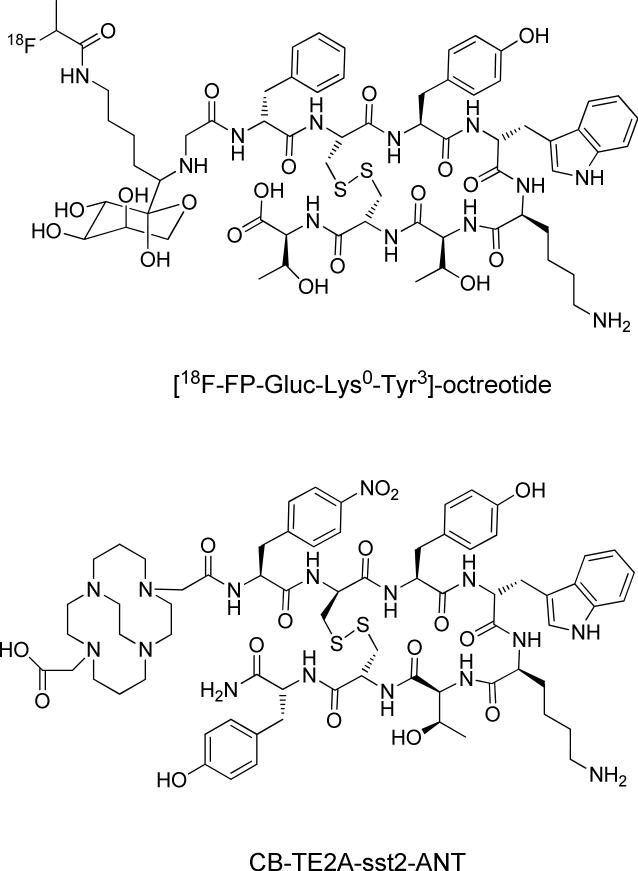
Selected somatostatin analogs.
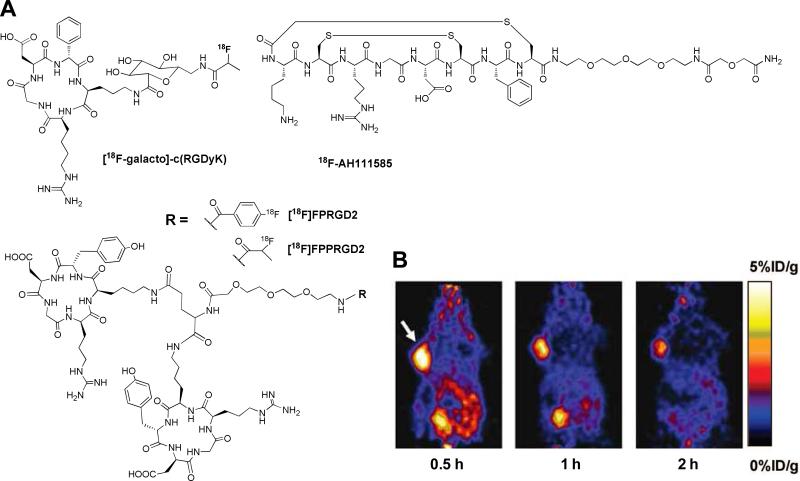
(A) Selected RGD analogs for PET imaging. (B) Serial microPET images of U87MG
tumor-bearing mice after intravenous injection of [18F]FPRGD2.
Arrow indicates tumor. Modified with permission from ref. . Copyright 2007,
Springer-Varlag.
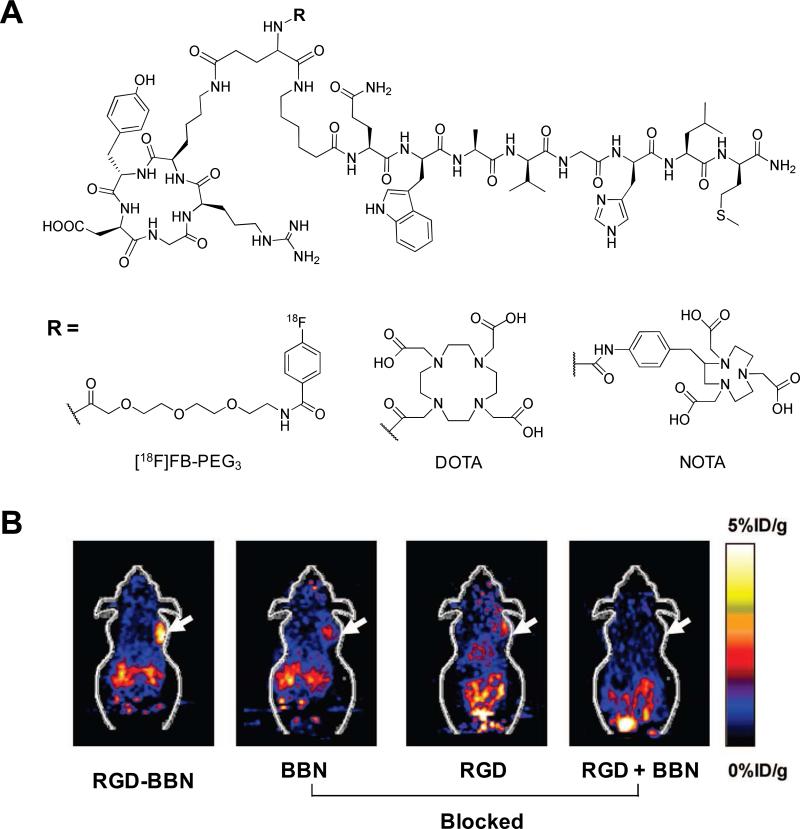
(A) Selected RGD-BBN heterodimers. (B) Coronal microPET images of PC-3
tumor-bearing mice at 1 h after intravenous injection of
[18F]FB-PEG3-Glu-RGD-BBN and a blocking dose of BBN peptide,
c(RGDyK), or RGD + BBN peptides. Arrows indicate tumors. Modified with
permission from ref. . Copyright
2009, American Chemical Society.
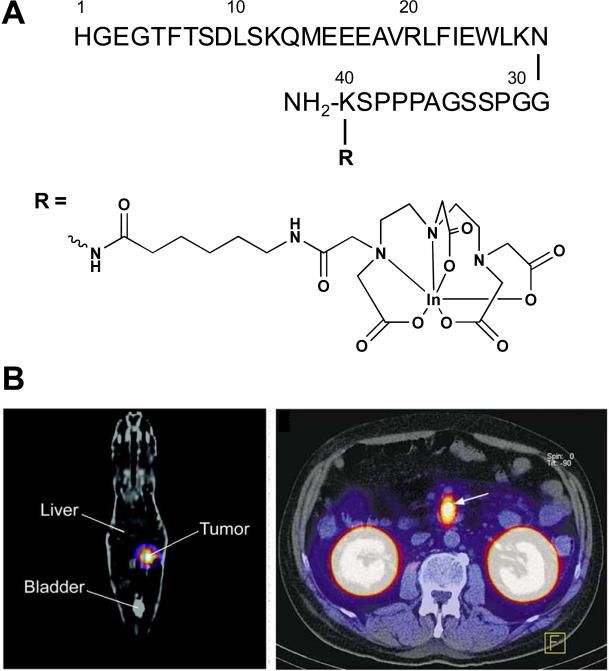
(A) Structure of [111In-Ahx-DTPA-Lys40]-Exendin-4. (B)
GLP-1 receptor scanning of insulinoma; (left) coronal SPECT image of a tumor
bearing Rip1Tag2 mouse and (right) transaxial SPECT image of an insulinoma
in patient. Arrows indicate tumors. Modified with permission from ref. and . Copyright 2006, the Society of Nuclear Medicine,
Inc. Copyright 2008, the Massachusetts Medical Society.
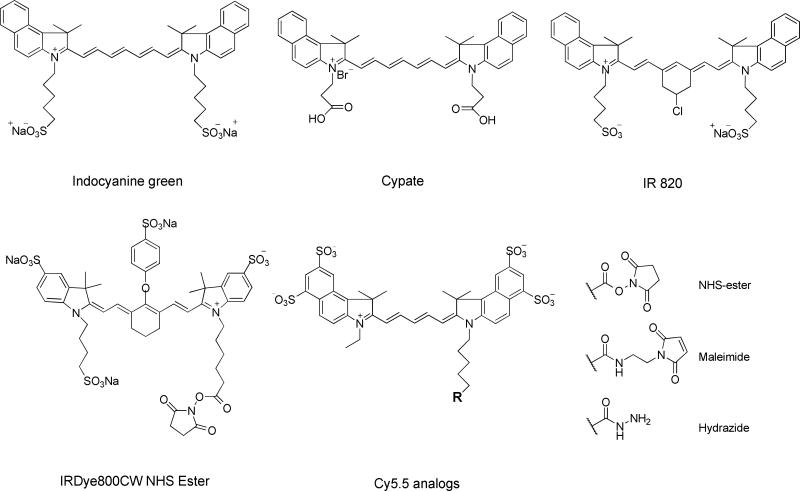
Selected near-infrared (NIR) dyes.
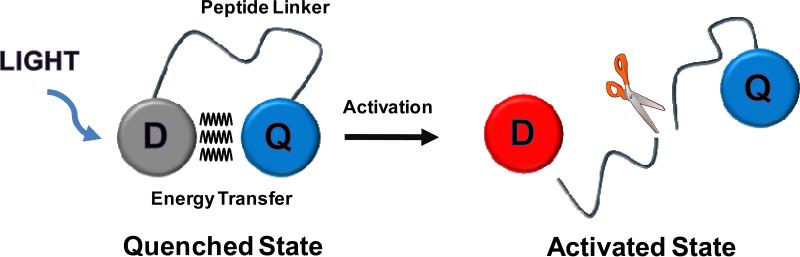
Simple schematic diagram of peptide-based activatable probe; D: Dye and Q:
quencher.
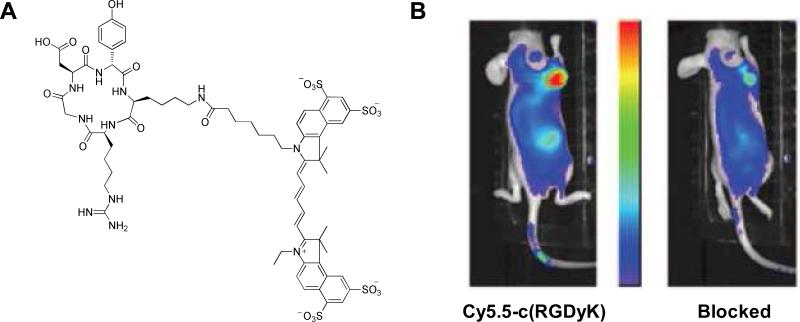
(A) Structure of c(RGDyK)-Cy5.5. (B) In vivo NIR
fluorescence images of U87MG tumor-bearing mice at 4 h after intravenous
injection of c(RGDyK)-Cy5.5 only (left) and a blocking dose of c(RGDyK)
peptide (right). Modified with permission from ref. . Copyright 2004, the American Association for
Cancer Research.
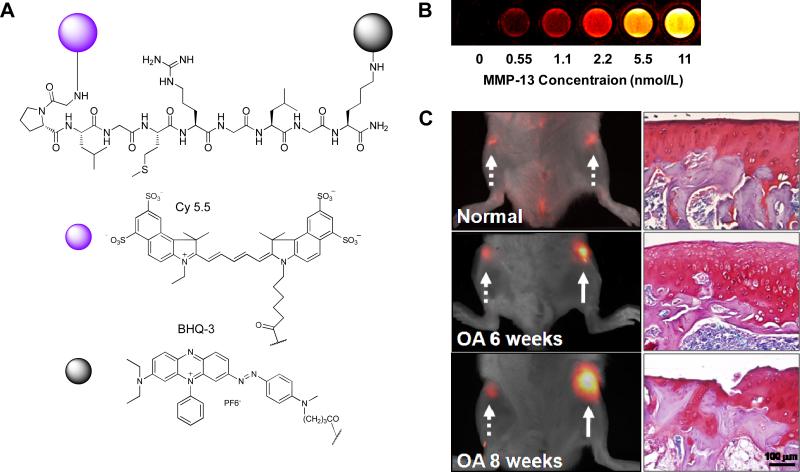
(A) Structure of MMP-13 activatable peptide-based probe,
Cy5.5-GPLGGMRGLGK(BHQ-3)-NH2. (B) NIR fluorescence image of
the probe in various concentrations of MMP-13 after a 40 min incubation at
37°C. In vivo imaging of upregulated MMP-13 in
normal, six and eight week OA-induced cartilages 1 h after
intracartilage-injection of the probe; (left) NIR fluorescence reflectance
imaging of normal and OA cartilage after local injection of the probe,
(right) histological evaluation of normal, six and eight week OA joints by
Safranin-O staining, Arrows; dotted line (normal) and solid line (OA).
Modified with permission from ref. . Copyright 2009, American Chemical Society.
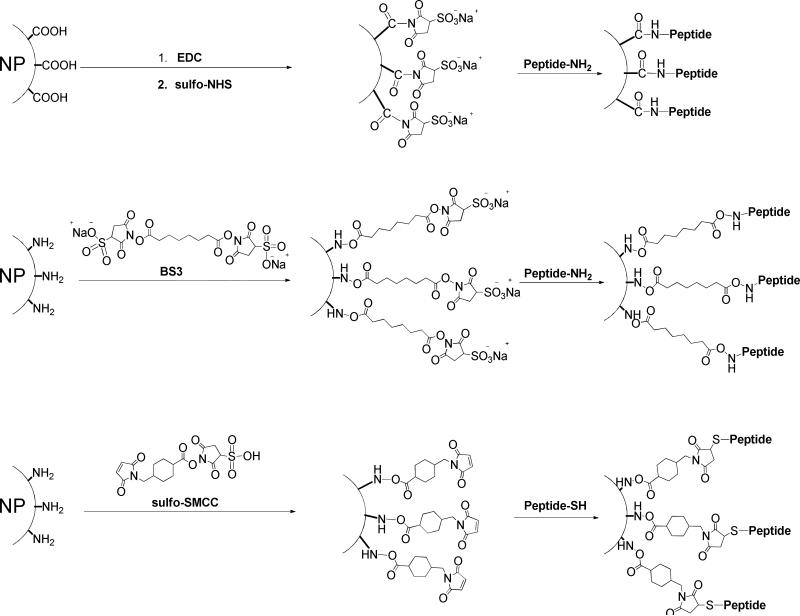
Nanoparticle-labeling of peptides.
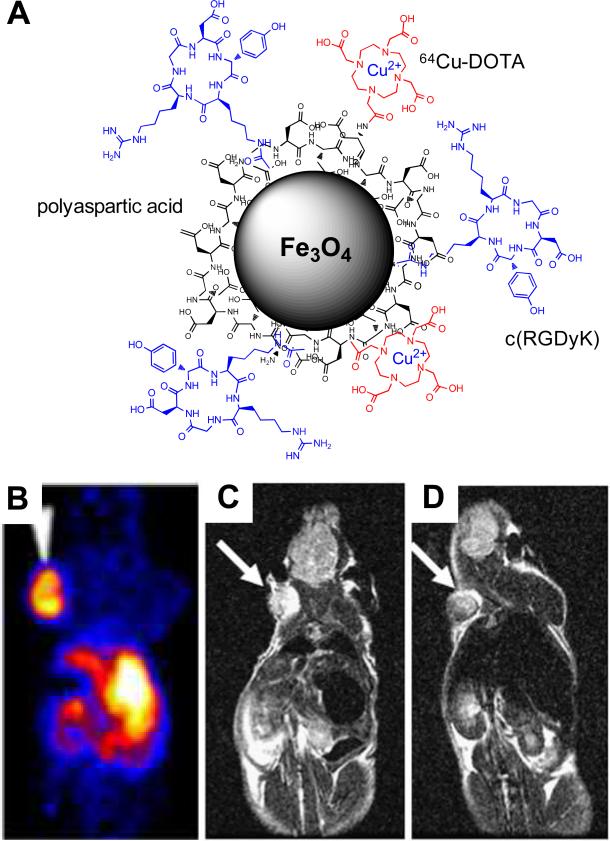
(A) Schematic diagram of 64Cu-DOTA-IONPs-c(RGDyK) probe for PETG
and MRI imaging. (B) microPET image of U87MG tumor-bearing mouse at 4 h
after intravenous injection of the probe. T2-weighted MR images of mice (the
arrow indicates the tumor) C) before and D) 4 h after intravenous injection
of the probe. Modified with permission from ref. . Copyright 2008, the Society of Nuclear Medicine,
Inc.
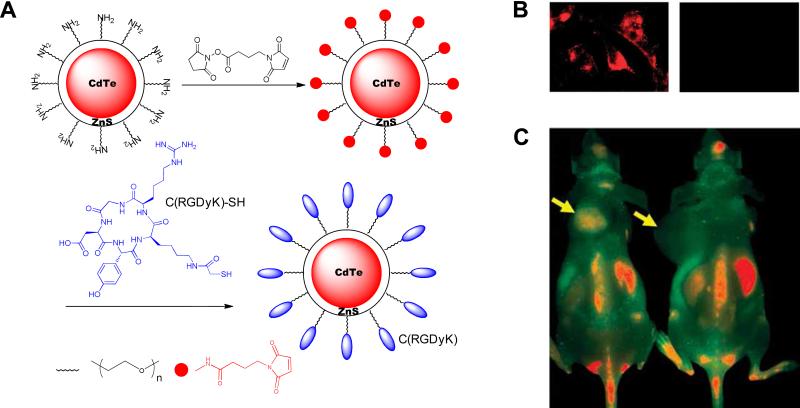
(A) Schematic diagram of QD705-RGD. (B) Staining of live U87MG cells with
QD705-RGD (left) and QD705 (right). (C) In vivo NIR
fluorescence imaging of U87MG tumor-bearing mice at 6 h after intravenous
injection of QD705-RGD (left) or QD705 (right). Arrows indicate tumors.
Modified with permission from ref. . Copyright 2009, American Chemical Society.
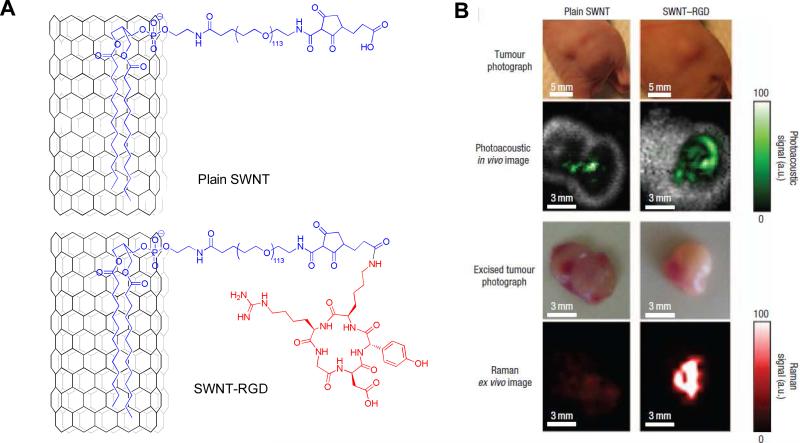
(A) Schematic diagrams of single-walled carbon nanotubes (plain SWNT) and
SWNT–RGD. (B) Photographs of the tumors in mice and the corresponding
photoacoustic subtraction images (green) shown as horizontal slices through
the tumors. After the photoacoustic scan, the tumors were excised and
scanned using a Raman microscope (red). Modified with permission from ref.
. Copyright 2008, Macmillan
Publishers Limited.
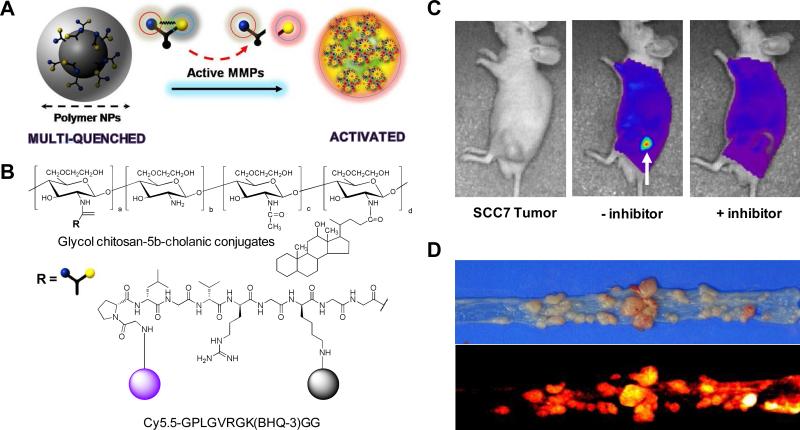
(A) Schematic diagrams of MMPs activatable polymeric nanoparticle-based
probe. (B) Structures of the probe. (C) In vivo NIR
fluorescence images of subcutaneous MMP-positive SCC7 tumor-bearing mice
after intravenous injection of the probe with or without the MMP inhibitor.
Only tumors injected with the probe without inhibitor were clearly
visualized. (D) Upper: photo image of colon tumors from an A/J mouse treated
with azoxymethane (AOM), lower: NIR fluorescence image of MMP-positive colon
tumors after intravenous injection of the probe.
Similar articles
-
Phage display in molecular imaging and diagnosis of cancer.Chem Rev. 2010 May 12;110(5):3196-211. doi: 10.1021/cr900317f. Chem Rev. 2010. PMID: 20170129 Free PMC article. Review. No abstract available.
-
Targeting Peptide-Based Probes for Molecular Imaging and Diagnosis.Adv Mater. 2019 Nov;31(45):e1804827. doi: 10.1002/adma.201804827. Epub 2018 Dec 7. Adv Mater. 2019. PMID: 30537222 Review.
-
Protein and peptide probes for molecular imaging.Amino Acids. 2011 Nov;41(5):1009-12. doi: 10.1007/s00726-011-0945-8. Amino Acids. 2011. PMID: 21643775 Free PMC article. No abstract available.
-
Optical and multimodal peptide-based probes for in vivo molecular imaging.Anticancer Agents Med Chem. 2012 Jun;12(5):476-99. doi: 10.2174/187152012800617858. Anticancer Agents Med Chem. 2012. PMID: 22292759 Review.
-
Peptide-based nanoprobes for molecular imaging and disease diagnostics.Chem Soc Rev. 2018 May 21;47(10):3490-3529. doi: 10.1039/c7cs00793k. Chem Soc Rev. 2018. PMID: 29497722 Review.
Cited by
-
Target molecule imaging on tissue specimens by fluorescent metal nanoprobes.J Biomed Opt. 2011 Nov;16(11):116004. doi: 10.1117/1.3644394. J Biomed Opt. 2011. PMID: 22112109 Free PMC article.
-
Enzymatic self-assembly of nanostructures for theranostics.Theranostics. 2012;2(2):139-47. doi: 10.7150/thno.3696. Epub 2012 Feb 2. Theranostics. 2012. PMID: 22375155 Free PMC article.
-
Novel Small Molecule Probes for Metastatic Melanoma.ACS Med Chem Lett. 2016 Dec 9;8(2):179-184. doi: 10.1021/acsmedchemlett.6b00368. eCollection 2017 Feb 9. ACS Med Chem Lett. 2016. PMID: 28197308 Free PMC article.
-
Progress in molecular imaging in endoscopy and endomicroscopy for cancer imaging.J Healthc Eng. 2013;4(1):1-22. doi: 10.1260/2040-2295.4.1.1. J Healthc Eng. 2013. PMID: 23502247 Free PMC article. Review.
-
Anti-Cancer Peptides: Status and Future Prospects.Molecules. 2023 Jan 23;28(3):1148. doi: 10.3390/molecules28031148. Molecules. 2023. PMID: 36770815 Free PMC article. Review.
References
Publication types
MeSH terms
Substances
Grants and funding
LinkOut - more resources
Full Text Sources
Other Literature Sources
