

Review
doi: 10.1021/cr9003538.
Multimodality imaging probes: design and challenges
Affiliations
- PMID: 20225900
- PMCID: PMC2878382
- DOI: 10.1021/cr9003538
Item in Clipboard
Review
Multimodality imaging probes: design and challenges
Chem Rev.
.
No abstract available
Figures
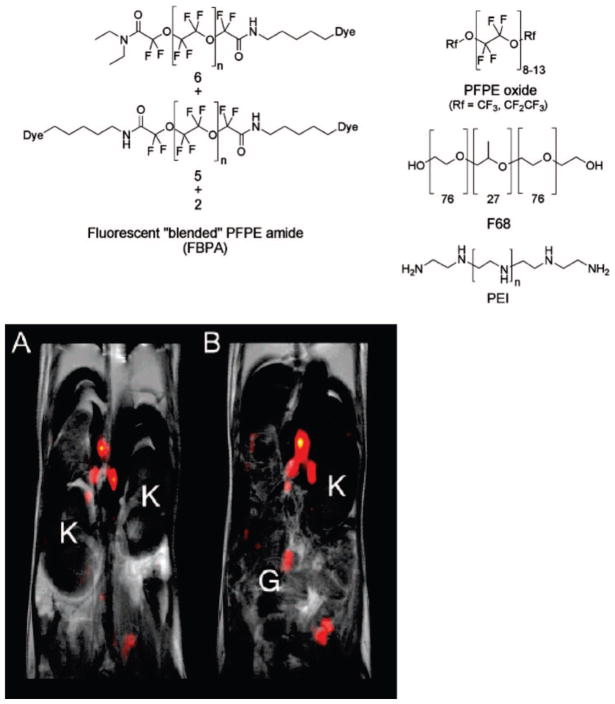
Polyperfluoroether coupled to cadaverine and organic fluorophore. A mixture of FBPA, PFPE oxide, and PEI is used to form nanoemulsions. 19F MR overlaid with 1H MRI images show signal enhancement in lymph nodes. In the lower panel, A and B are consecutive 2 mm slices through the torso: K = kidney; G = gut. Reproduced with permission from ref . Copyright 2008 American Chemical Society.
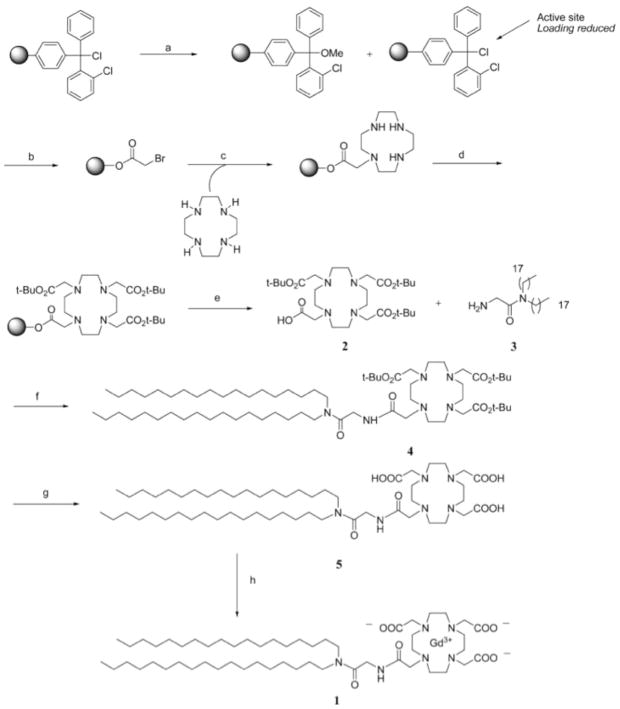
Synthesis of GdDOTA labeled lipid. Reproduced with permission from ref . Copyright 2008 American Chemical Society. Reagents and conditions: (a) MeOH, DIEA, CH2Cl2, rt, 4 h; MeOH partial capping was used to prevent moleculer overcrowding in the chlorotrityl resin; (b) BrCH2COOH, DIEA, CH2Cl2, rt, 12 h; (c) cyclen, rt, 4 h; (d) BrCH2CO2C(CH3)3, Et3N, DMF, rt, 12 h; (e) TFEtOH/CH2Cl2, rt, 2 h, 69%; (f) HBTU, DMAP, dry CHCl3, 40 °C, 12 h, 88%; (g) conc. HCl/dioxane, rt, 2 h, 68%; (h) GdCl3, H2O, 90 °C, 12 h, 99%.
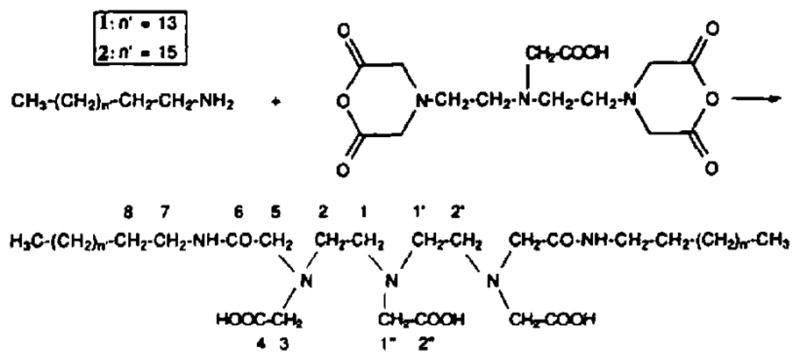
Synthesis of amphiphilic chelating agent. Reproduced with permission from ref . Copyright 1992 Elsevier.
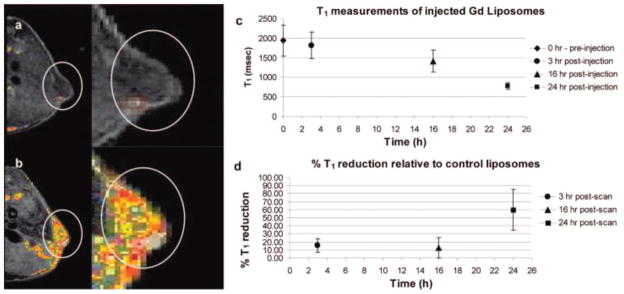
IGROV-1 tumors in the flanks of nude Balb/c mice: (a) MR images preinjection; (b) postinjection of Gd–liposomes; (c) T1 measurements from tumor slices show gradual reduction of T1 with time; (d) T1 reduction from animals injected with Gd–liposomes relative to tissue from animals injected with control liposomes (no gadolinium) is greatest at 24 h, with little difference in T1 reduction prior to that time point. Reproduced with permission from ref . Copyright 2008 American Chemical Society.
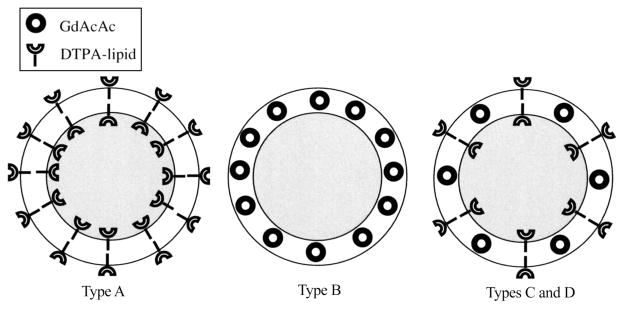
Three types of liposome designs containing GdAcAc and DTPA for chelating 99mTc and 166Ho. In types C and D, some fraction of the chelators face internally and are unavailable for metalation. Reproduced with permission from ref . Copyright 2006 Mary Ann Liebert, Inc.
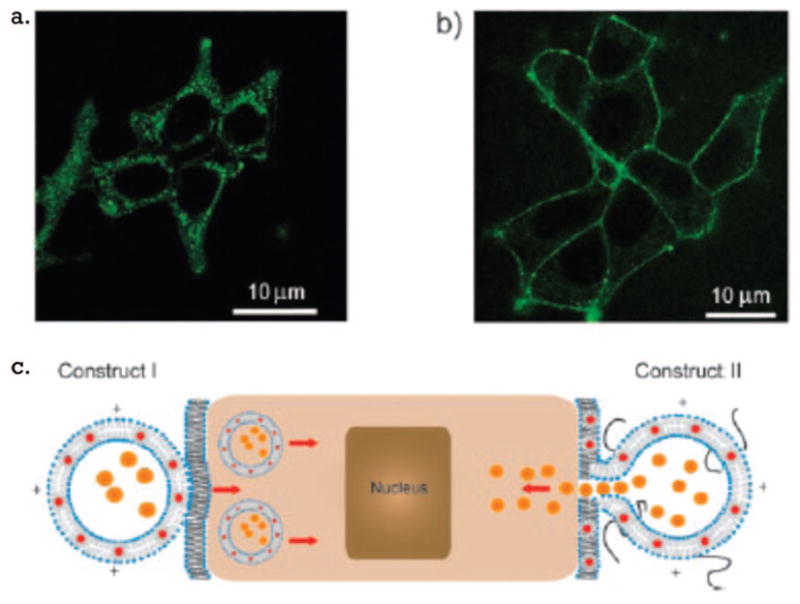
Labeling of cells with (a) probes intended for internalization and (b) probes for fusion to the cell membrane and (c) schematic representation of the probes’ interactions with cells. Reproduced with permission from ref . Copyright 2006 Wiley-VCH Verlag GmbH & Co. KGaA.
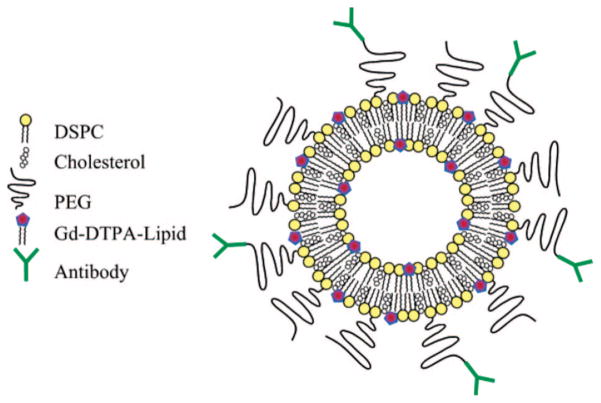
Gadolinium labeled liposome. Gadolinium labeled lipids reside on inner and outer leaflets. DSPC = 1,2-distearoyl-sn-glycero-3-phosphocholine. Reproduced with permission from ref . Copyright 2004 American Chemical Society.
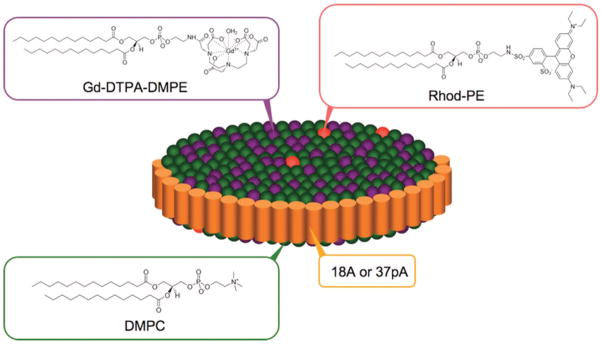
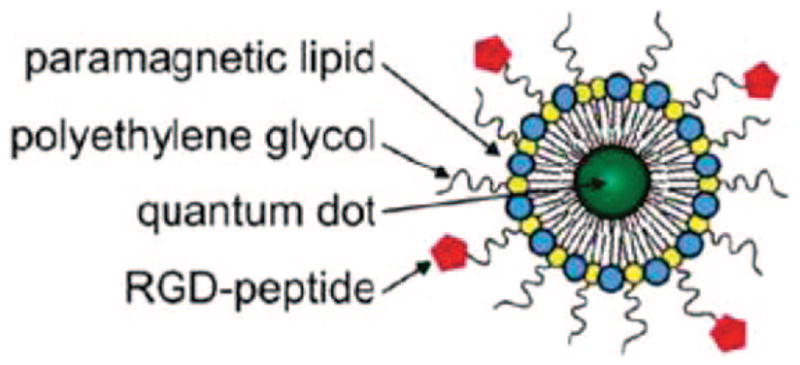
High-density lipoprotein-like particle carrying MRI and optical probes. Reproduced with permission from ref . Copyright 2008 American Chemical Society.
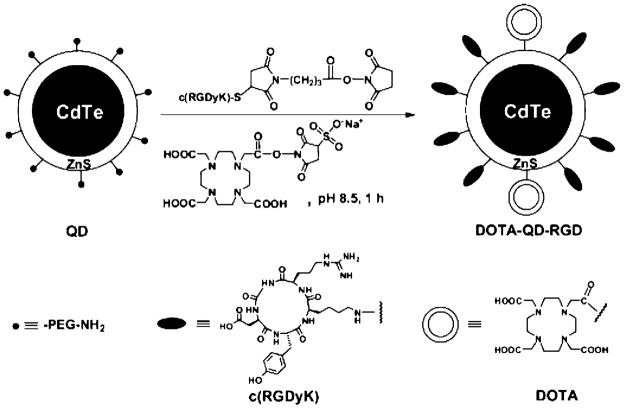
Chelator coupling to surface of CdTe nanoparticles. Reproduced with permission from ref . Copyright 2007 Society of Nuclear Medicine.
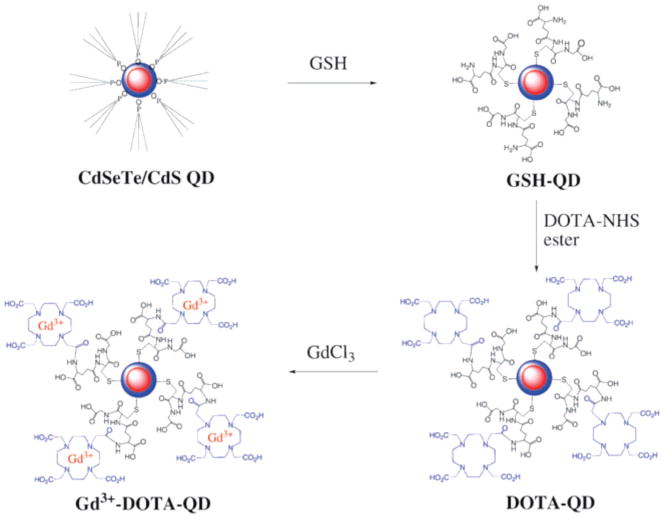
Chelator coupling to CdSeTe/CdS quantum dots. Reproduced with permission from ref . Copyright 2008 Royal Society of Chemistry.
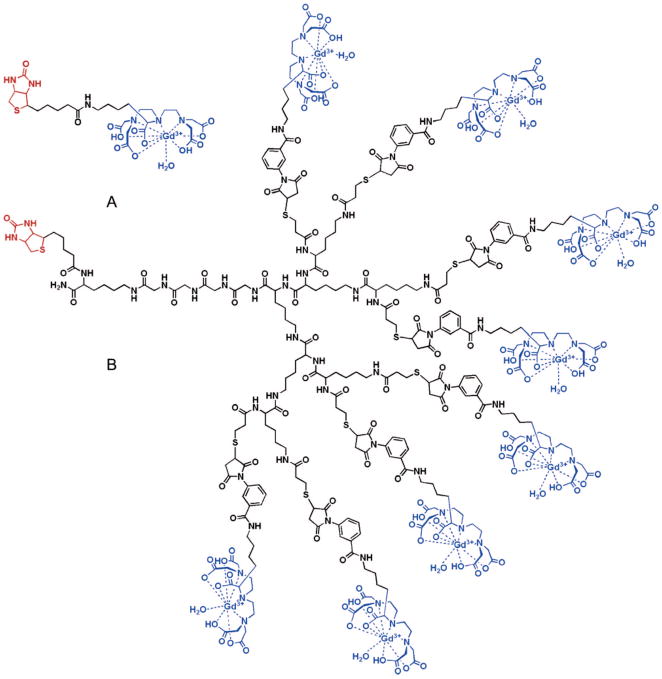
Biotin–avidin dendritic approach to coupling Gd–DTPA to nanoparticles: Shown are biotinylated GdDTPA (A), which is incorporated to a dendritic “wedge” (B) that is coupled to an avidin-modified nanoparticle. Reproduced with permission from ref . Copyright 2007 American Chemical Society.
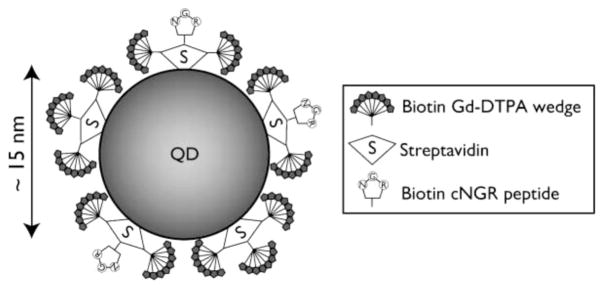
Schematic illustration of dendritic wedges decorating a nanoparticle surface. Reproduced with permission from ref . Copyright 2008 American Association for Cancer Research.
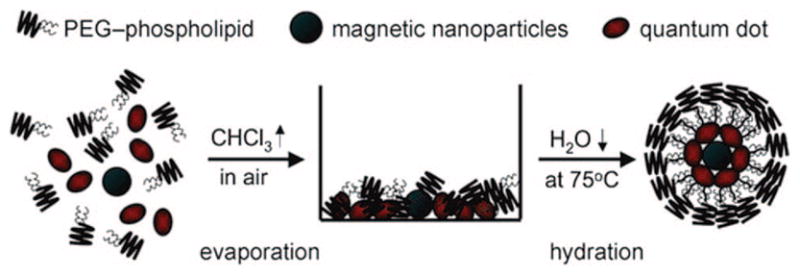
Coencapsulating of iron oxides and quantum dots in micelles. Reproduced with permission from ref . Copyright 2008 Wiley-VCH Verlag GmbH & Co. KGaA.
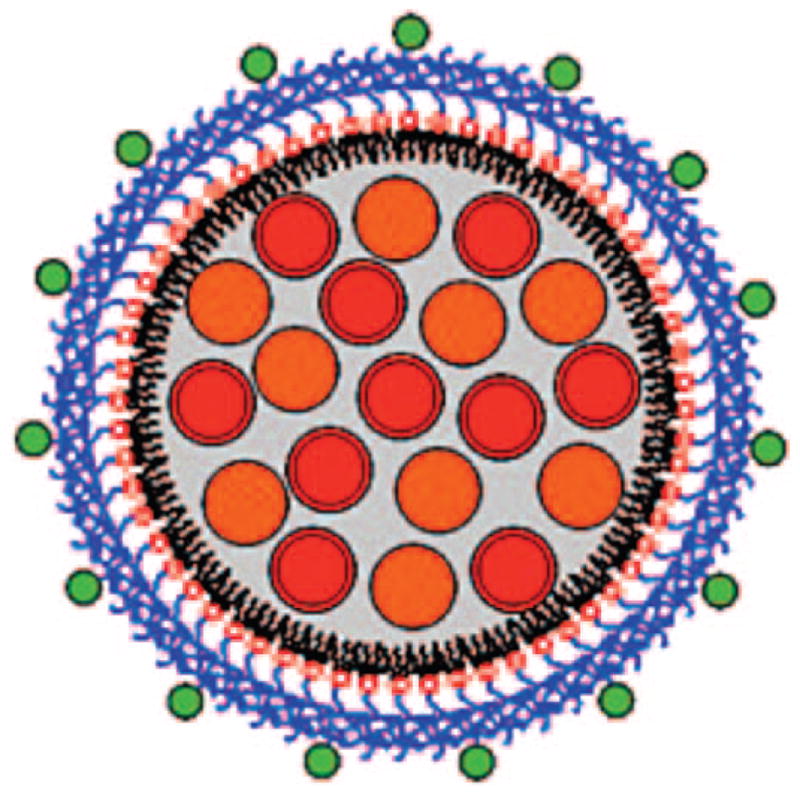
Coencapsulation of quantum dots (red) and iron oxides (orange) in micelles containing biotin (green)-modified amphiphiles. Reproduced with permission from ref . Copyright 2008 American Chemical Society.
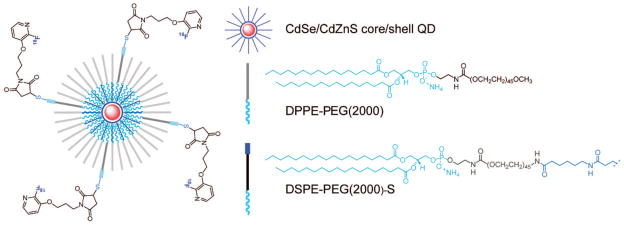
Quantum dots with fluorescently labeled lipid shells. Reproduced with permission from ref . Copyright 2009 American Chemical Society.
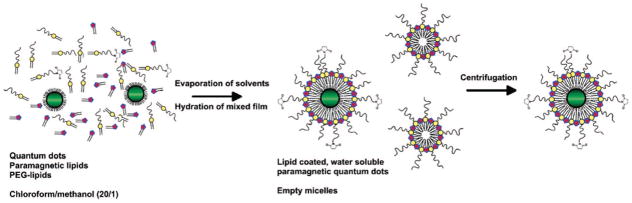
Synthesis of lipid-coated quantum dots. Reproduced with permission from ref . Copyright 2006 American Chemical Society.
18F-labeled lipid-coated quantum dot. Reproduced with permission from ref . Copyright 2008 American Chemical Society.
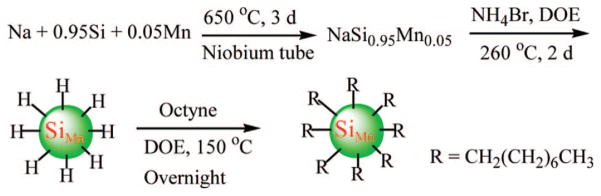
Synthesis of hydrogen-capped silicon nanoparticles doped with manganese.
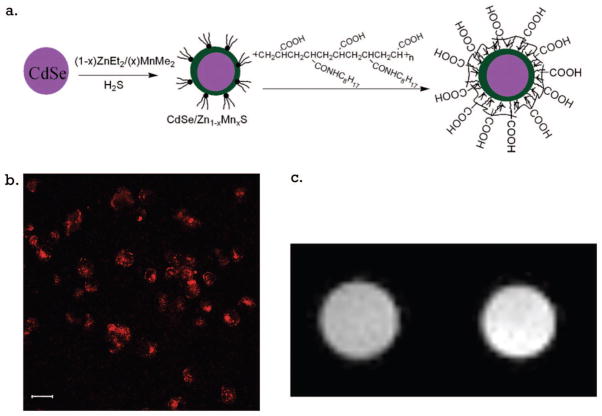
(a) Synthesis of CdSe quantum dots with manganese-doped ZnS shells. (b) Confocal image of cells incubated with Mn containing QDs. (c) MRI images of cells incubated with (right) and without (left) quantum dots. Reproduced with permission from ref . Copyright 2007 American Chemical Society.
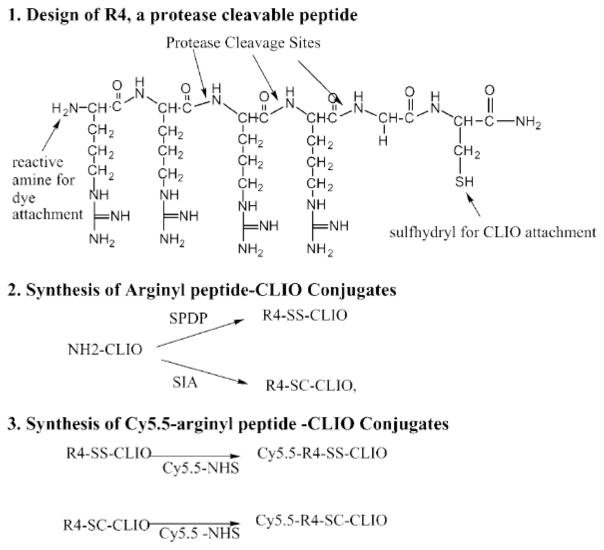
Synthesis of Cy5.5-labeled CLIO-bearing targeting peptides. Reproduced with permission from ref . Copyright 2002 American Chemical Society.
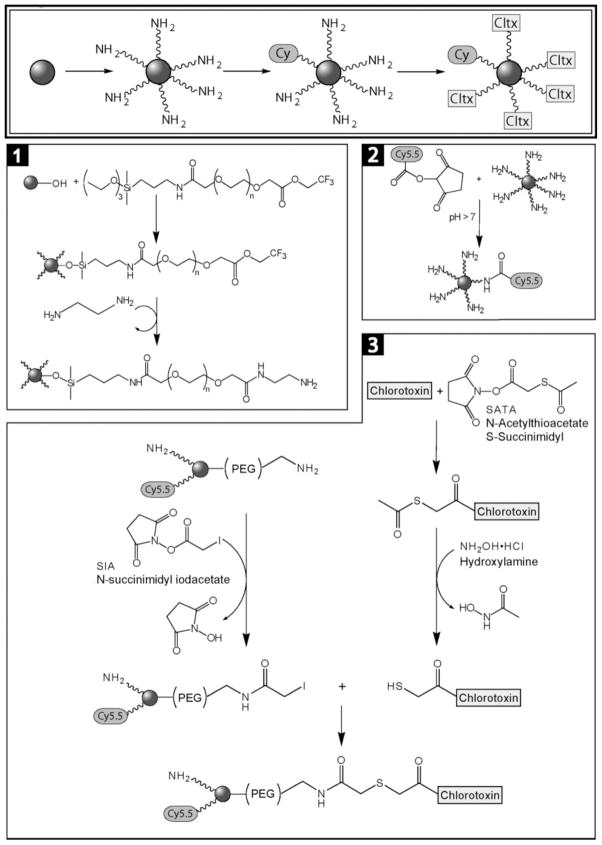
Synthesis of PEG-coated CLIO conjugated to Cy5.5 and chlorotoxin: (1) PEG silane coupling to nanoparticles (NPs) and conversion to amine termination; (2) Cy5.5 maleimide derivative reacts with amine terminated NPs; (3) chlorotoxin conjugation to NPs. Reproduced with permission from ref . Copyright 2005 American Chemical Society.
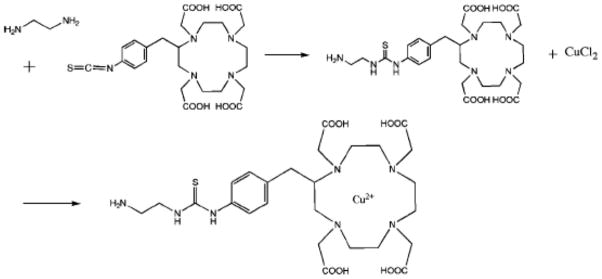
Amination of benzyl-DOTA derivatives. Reproduced with permission from ref . Copyright 2008 American Chemical Society.
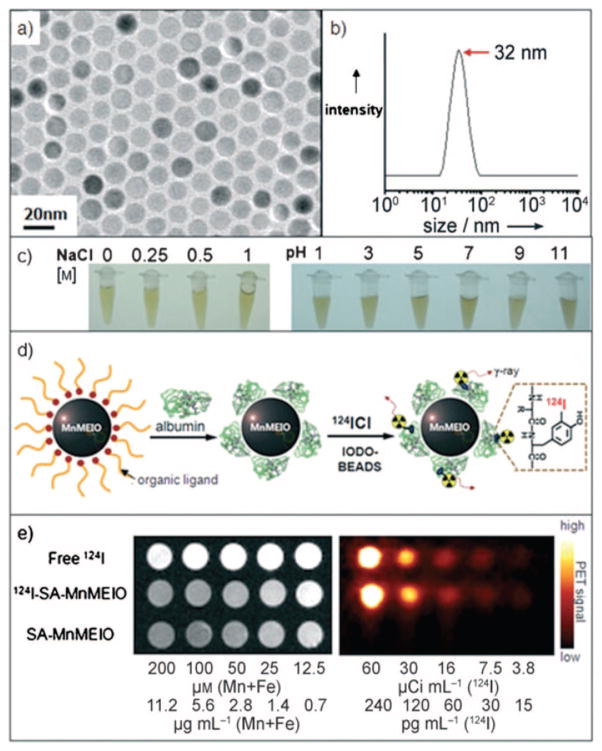
124I-labeled Mn-doped iron oxide (MnMEI): (a) MnMEI; (b) DLS size; (c) stability of the particles at different salt concentrations and pH; (d) radiolabeling of the particles; (e) MRI (left) and PET (right) images of solutions of free radiotracer, multimodal probe, and MR only probe. Reproduced with permission from ref . Copyright 2008 Wiley-VCH Verlag GmbH & Co. KGaA.
Silica-coated iron oxide nanoparticles. Reproduced with permission from ref . Copyright 2007 American Chemical Society.
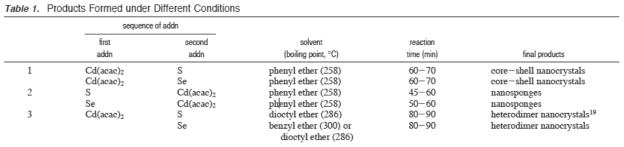
FePt core/QD shell nanoparticles. Effect of reaction conditions on structure of final product. Reproduced with permission from ref . Copyright 2007 American Chemical Society.
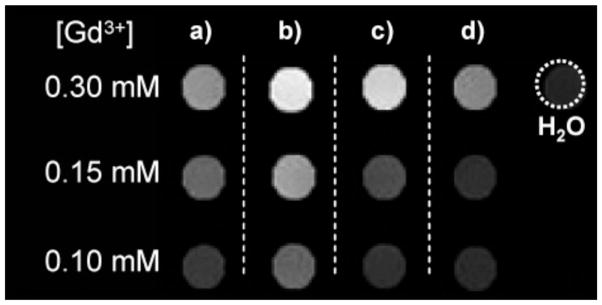
Gd2O3 nanoparticles. Effect of size on relaxivity: (a) Gd–DOTA; nanoparticles of diameter (b) 3.8, (c) 3.8, or (d) 4.6 nm. Water blank is shown on the right. Reproduced with permission from ref . Copyright 2007 American Chemical Society.
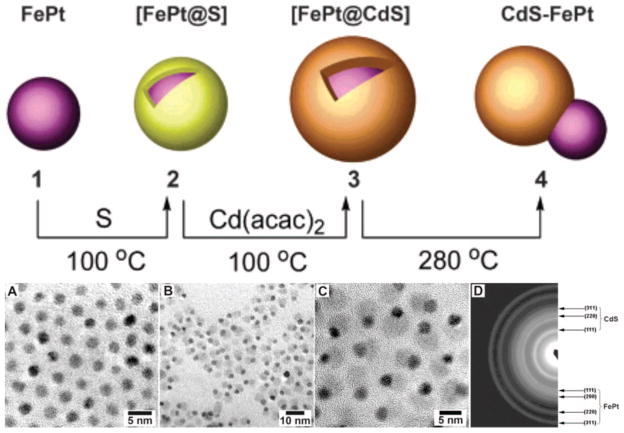
Formation of FePt–CdS heterodimers: (A) FePt particles; (B) FePt–CdS heterdimers; (C) high-resolution EM; (D) selected area electron diffraction (SAED) shows rings from characteristic phases of fcc disordered FePt and zinc blende CdS. Reproduced with permission from ref . Copyright 2004 American Chemical Society.
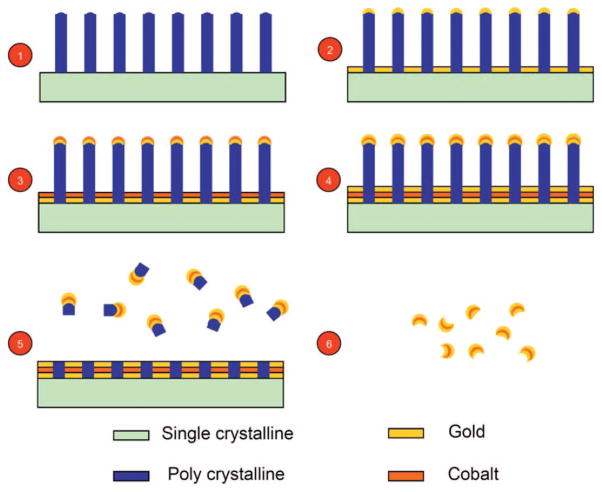
Building of nanowonton structures on silicon pillars: (1) pillars; (2) gold deposited on pillars followed by (3) a layer of cobalt and (4) another layer of gold; (5) the pillars are etched away leaving (6) nanowontons. Reproduced with permission from ref . Copyright 2009 National Academy of Sciences, U.S.A.
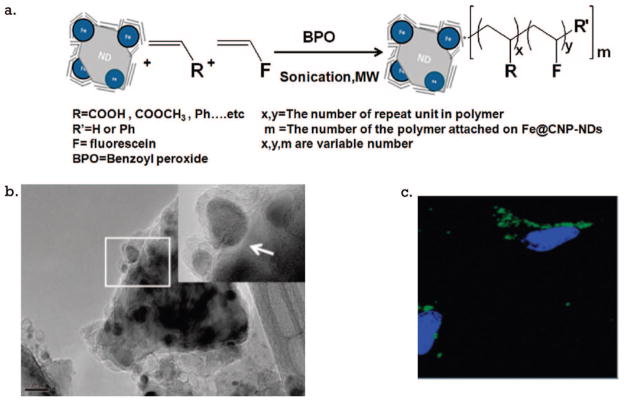
(a) Synthesis of magnetic nanodiamonds surface-functionalized with fluorescein. (b) TEM of the magnetic nanodiamonds showing iron–carbon nanoparticles on surface of the nanodiamonds. (c) When applied to cells, the nanodiamonds appear primarily near the cell surface. Reproduced with permission from ref . Copyright 2008 American Chemical Society.
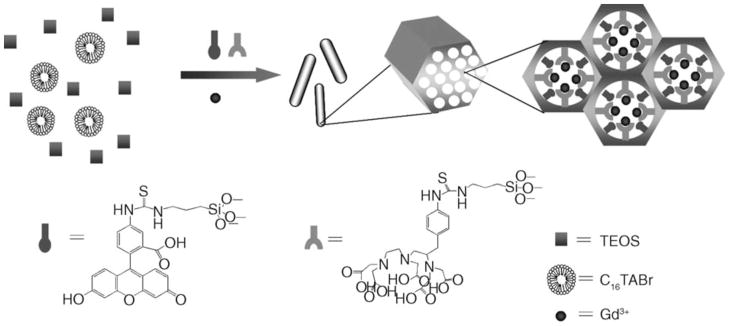
Silica nanorods loaded with gadolinium and fluorescein. Reproduced with permission from ref . Copyright 2008 Wiley-VCH Verlag GmbH & Co. KGaA.
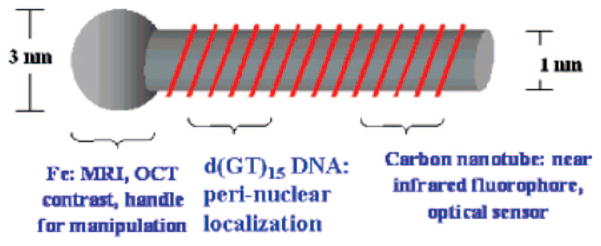
Carbon nanotubes with iron oxide on one end. Reproduced with permission from ref . Copyright 2007 American Chemical Society.
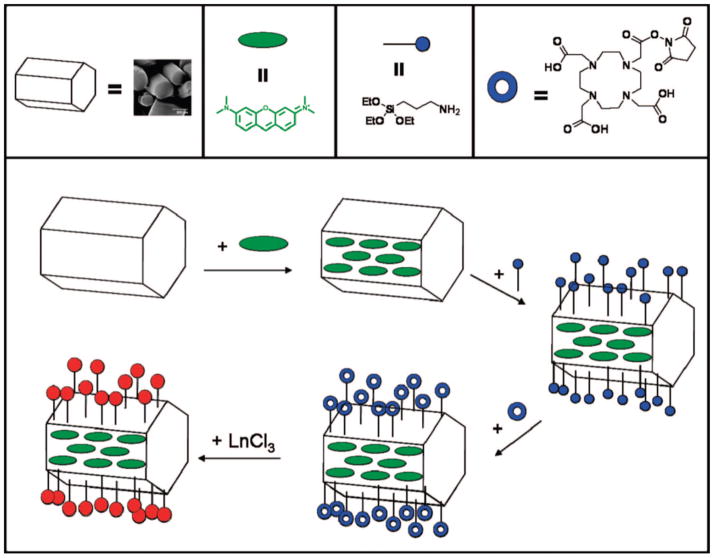
Zeolite nanocontainers loaded with dye and lanthanides. Reproduced with permission from ref . Copyright 2008 American Chemical Society.
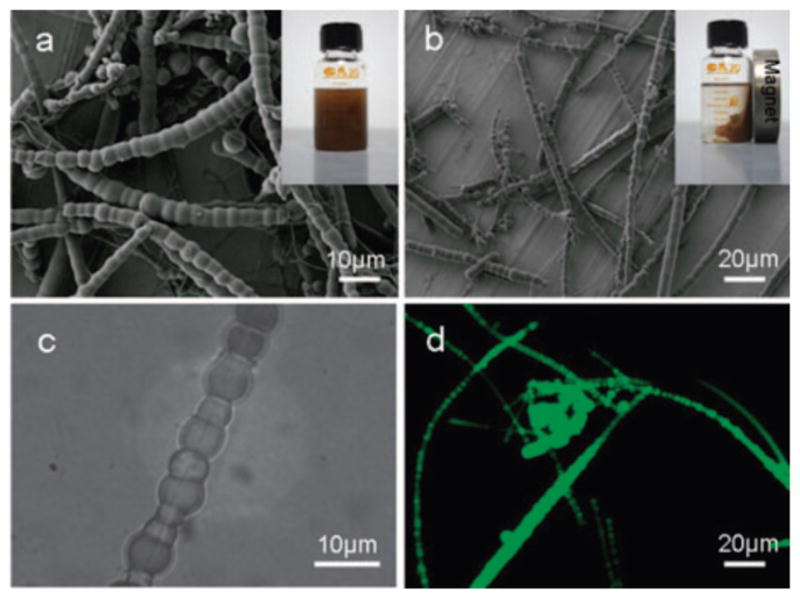
Cables of CuPVA loaded with iron oxide nanoparticles: (a) pure nanocables; (b) magnetic nanocables, attracted to magnet at side; (c) magnetite nanoparticles attached to cables; (d) fluorescent images of nanocables. Reproduced with permission from ref . Copyright 2009 Royal Society of Chemistry.
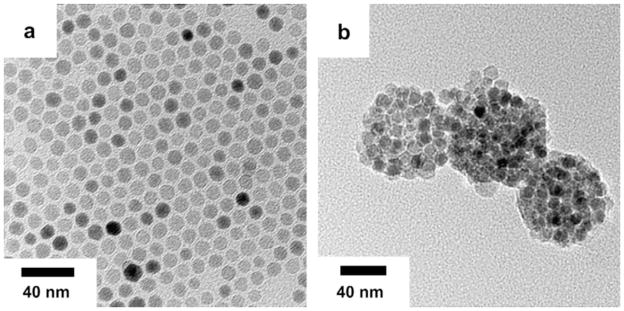
PCl-b-PMMA nanoparticles loaded with magnetic nanocrystals: (a) magnetic nanocrystals; (b) fluorecent magnetic nanohybrids. Reproduced with permission from ref . Copyright 2008 Elsevier.
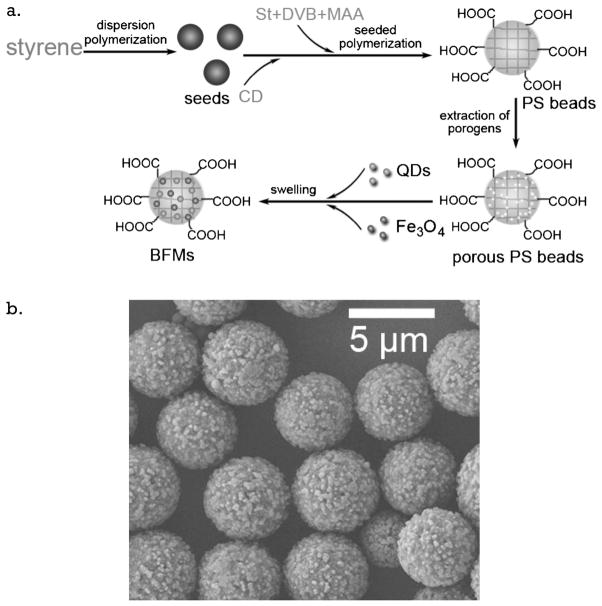
(a) Styrene particles loaded with iron oxides and quantum dots by swelling and shrinking method. (b) TEM of particles. Reproduced with permission from ref . Copyright 2007 The Chemical Society of Japan.
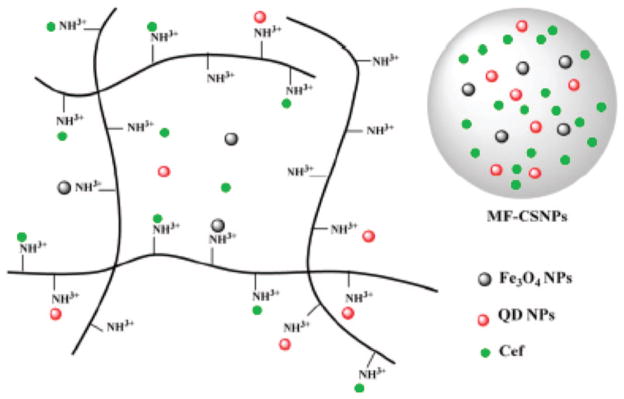
Quantum dots and iron oxides embedded in chitosan particles. Reproduced with permission from ref . Copyright 2007 Institute of Physics.
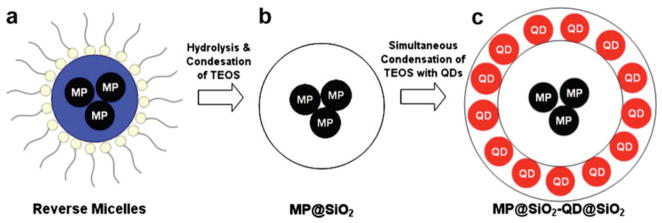
Iron oxides and quantum dots dispersed together in a silica core. Reproduced with permission from ref . Copyright 2007 Institute of Physics.
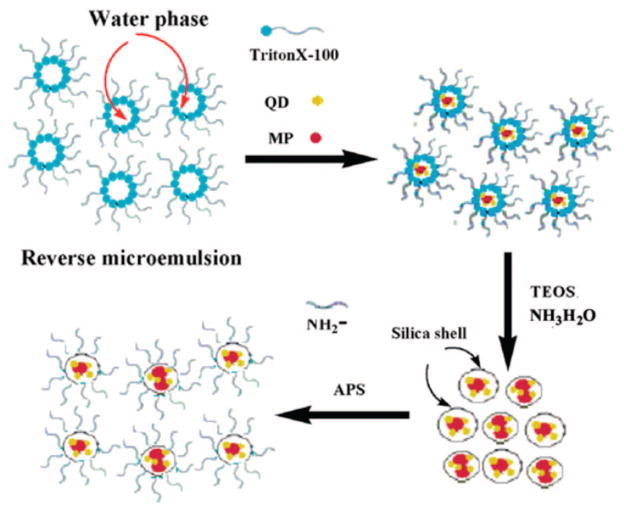
Quantum dots in silica shell around silica coated magnetic particles. Reproduced with permission from ref . Copyright 2008 Elsevier.
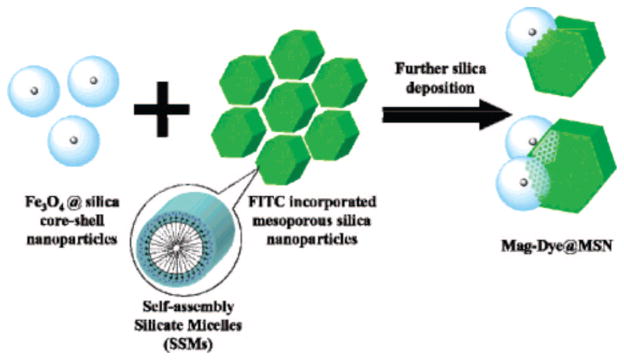
Silica-coated iron oxide particles deposited on FITC-doped silica nanoparticles. Reproduced with permission from ref . Copyright 2006 American Chemical Society.
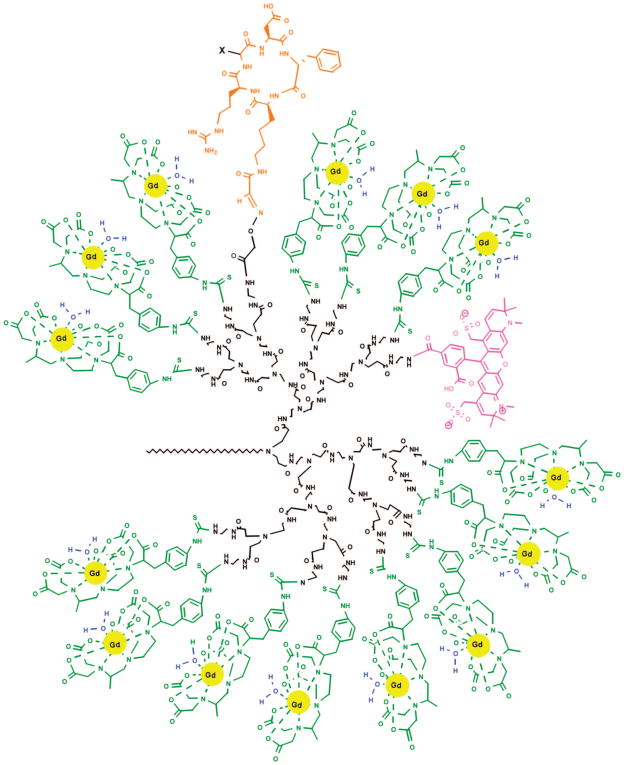
PAMAM dendrimer “arm” conjugated to gadolinium chelates (yellow/green), fluorescent dye (pink), and targeting peptide (orange). Reproduced with permission from ref . Copyright 2008 American Chemical Society.
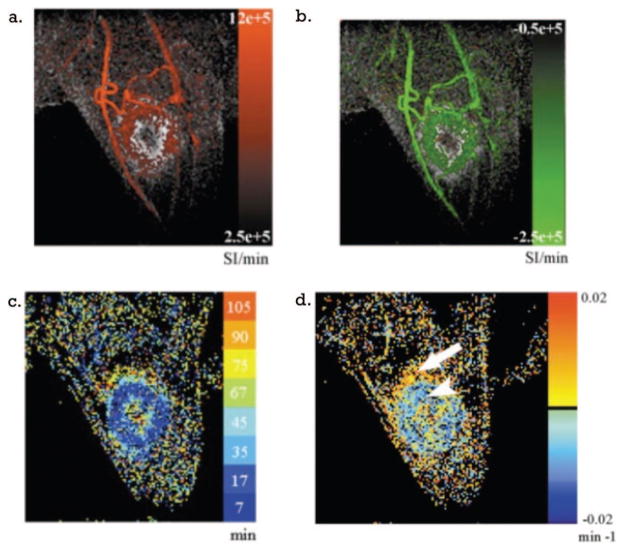
Use of triply labeled albumin to characterize probe extravasation into tumors: (a) contrast enhancement immediately after injection; (b) signal loss immediately after avidin chase; (c) convection map showing time when rate of probe accumulation was maximal; (d) map of accumulation (yellow-orange) and clearance (blues) after avidin chase. Reproduced with permission from ref . Copyright 2003 Wiley.
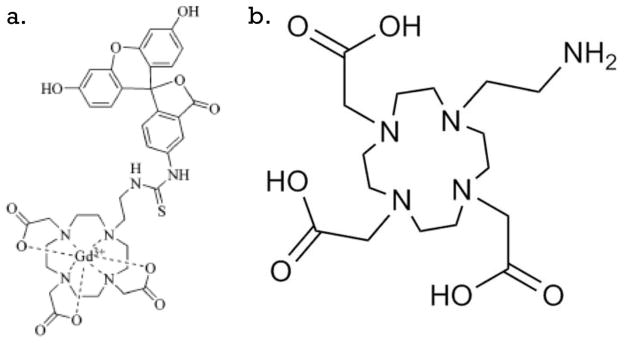
(a) Gd–DOTA–fluorescein pair. (b) DO3A precursor with NH2 terminated arm. Reproduced with permission from ref . Copyright 2006 American Chemical Society.
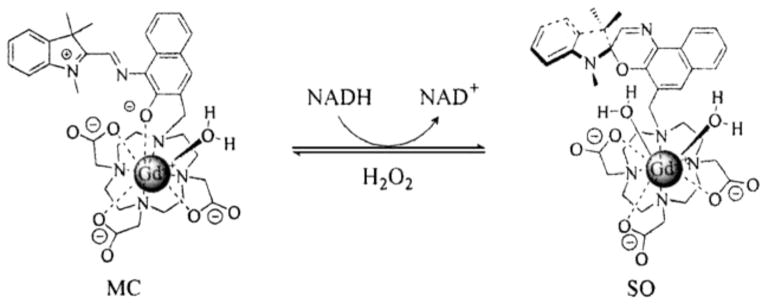
MRI/optical probe reversibly activated by NADH. Reproduced with permission from ref . Copyright 2009 Wiley-VCH Verlag GmbH & Co. KGaA.
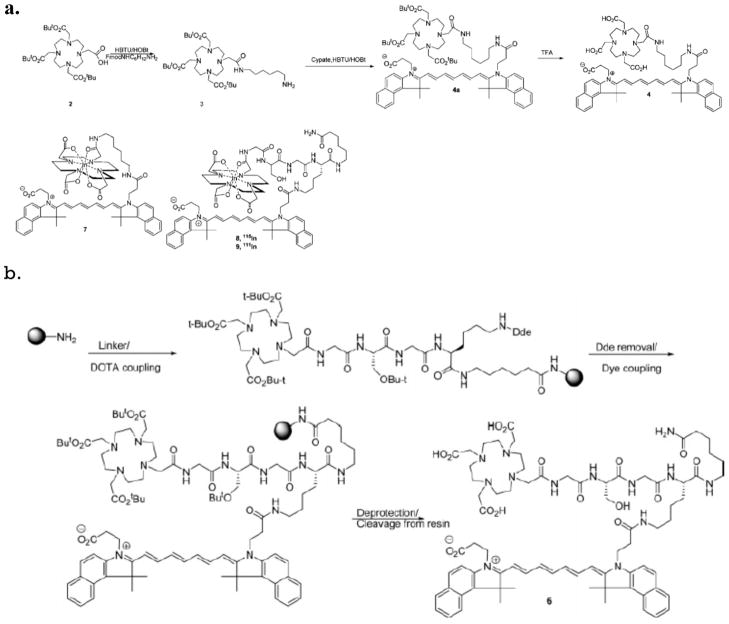
Conjugation of DOTA to cypate: (a) solution-phase coupling of DOTA to cypate through hexanediamine and 111In-labeled derivatives of cypate; (b) solid-phase synthesis of cypate–DOTA linked through lysine. Reproduced with permission from ref . Copyright 2005 American Chemical Society.
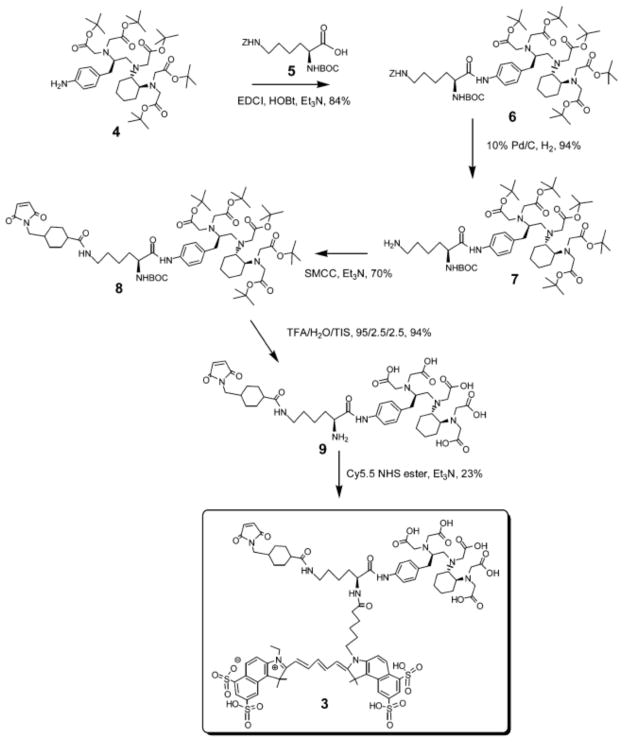
Synthesis of Cy5.5-labeled chelate, Cy5.5–Lys(SMCC)–CHX-A″. Reproduced with permission from ref . Copyright 2007 American Chemical Society.
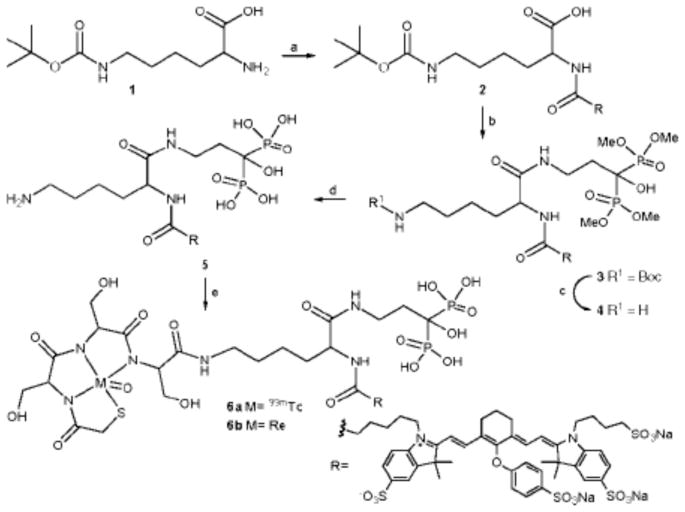
Synthesis of IRDye800 linked to Pam–99mTc. Reagents and conditions: (a) IRDye800CW–NHS, DIEA, DMSO, rt, 2 h, 89%; (b) Me-Pam, HCTU, NMM, DMSO, rt, 0.5 h, 78%; (c) 95% TFA, rt, 2.5 h, 97%; (d) Me3SiBr, DMF, rt, 12 h, and MeOH/H2O (4:1), rt, 0.5 h, 95%; (e) 99mTc/Re-MAS3-NHS, TEA, DMSO, rt, 1 h, 83%. Reproduced with permission from ref . Copryight 2008 American Chemical Society.
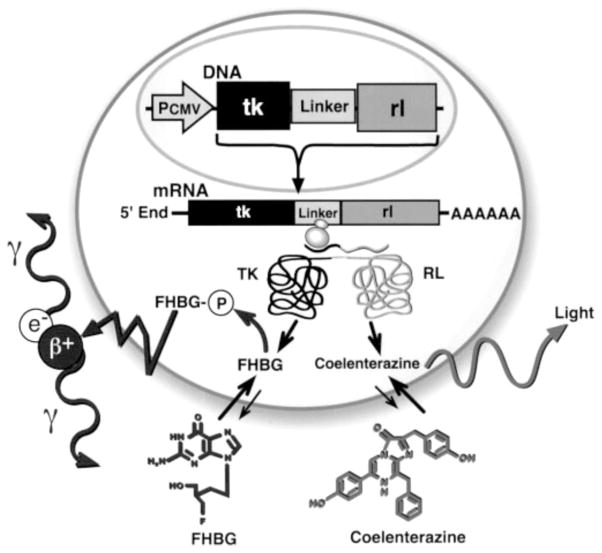
Multimodal reporter gene. Gene construct contains reporter genes for both luminescent (GFP) and radiotracer (thymidine kinase) imaging methodologies. The optical reporter gene produces a fluorescent protein product. The PET reporter gene produces a thymidine kinase that phosphorylates nucleoside analogs, which are then retained in cells. Reproduced with permission from ref . Copyright 2004 American Association for Cancer Research.
References
Publication types
MeSH terms
Substances
Grants and funding
LinkOut - more resources
Full Text Sources
Other Literature Sources
Medical
