

Mocapy++--a toolkit for inference and learning in dynamic Bayesian networks
- PMID: 20226024
- PMCID: PMC2848649
- DOI: 10.1186/1471-2105-11-126
Mocapy++--a toolkit for inference and learning in dynamic Bayesian networks
Abstract
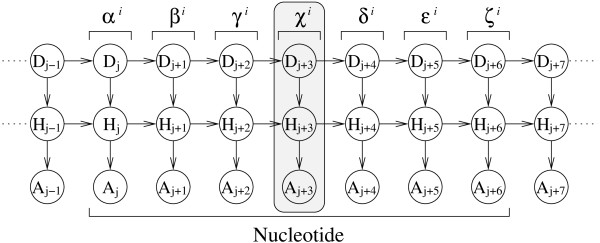
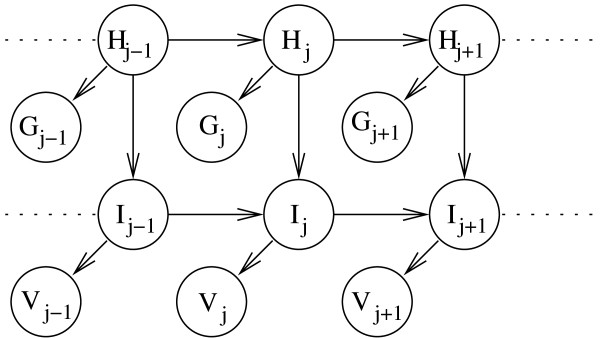
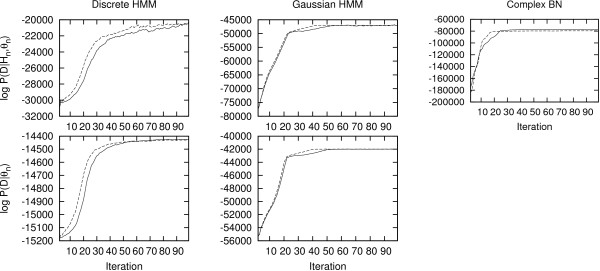
Background: Mocapy++ is a toolkit for parameter learning and inference in dynamic Bayesian networks (DBNs). It supports a wide range of DBN architectures and probability distributions, including distributions from directional statistics (the statistics of angles, directions and orientations).
Results: The program package is freely available under the GNU General Public Licence (GPL) from SourceForge http://sourceforge.net/projects/mocapy. The package contains the source for building the Mocapy++ library, several usage examples and the user manual.
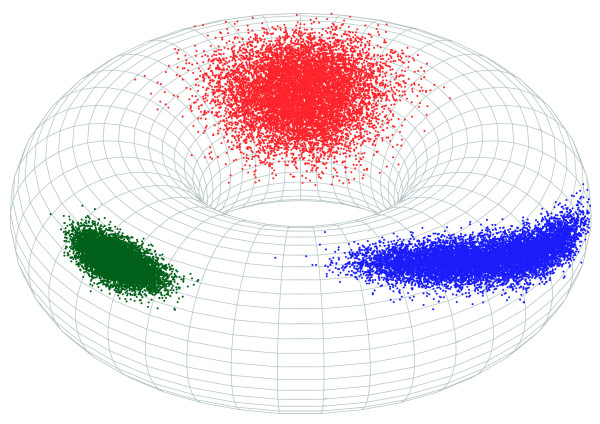
Conclusions: Mocapy++ is especially suitable for constructing probabilistic models of biomolecular structure, due to its support for directional statistics. In particular, it supports the Kent distribution on the sphere and the bivariate von Mises distribution on the torus. These distributions have proven useful to formulate probabilistic models of protein and RNA structure in atomic detail.
Figures

Similar articles
-
PHAISTOS: a framework for Markov chain Monte Carlo simulation and inference of protein structure.J Comput Chem. 2013 Jul 15;34(19):1697-705. doi: 10.1002/jcc.23292. Epub 2013 Apr 26. J Comput Chem. 2013. PMID: 23619610
-
GNU MCSim: Bayesian statistical inference for SBML-coded systems biology models.Bioinformatics. 2009 Jun 1;25(11):1453-4. doi: 10.1093/bioinformatics/btp162. Epub 2009 Mar 20. Bioinformatics. 2009. PMID: 19304877
-
BayesGCM: software for Bayesian inference with the generalized context model.Behav Res Methods. 2009 Nov;41(4):1111-20. doi: 10.3758/BRM.41.4.1111. Behav Res Methods. 2009. PMID: 19897818
-
Probability, statistics, and computational science.Methods Mol Biol. 2012;855:77-110. doi: 10.1007/978-1-61779-582-4_3. Methods Mol Biol. 2012. PMID: 22407706 Review.
-
Spiking networks for Bayesian inference and choice.Curr Opin Neurobiol. 2008 Apr;18(2):217-22. doi: 10.1016/j.conb.2008.07.004. Epub 2008 Aug 21. Curr Opin Neurobiol. 2008. PMID: 18678253 Review.
Cited by
-
Systems biology data analysis methodology in pharmacogenomics.Pharmacogenomics. 2011 Sep;12(9):1349-60. doi: 10.2217/pgs.11.76. Pharmacogenomics. 2011. PMID: 21919609 Free PMC article. Review.
-
New Algorithm and Software (BNOmics) for Inferring and Visualizing Bayesian Networks from Heterogeneous Big Biological and Genetic Data.J Comput Biol. 2017 Apr;24(4):340-356. doi: 10.1089/cmb.2016.0100. Epub 2016 Sep 28. J Comput Biol. 2017. PMID: 27681505 Free PMC article.
-
Beyond rotamers: a generative, probabilistic model of side chains in proteins.BMC Bioinformatics. 2010 Jun 5;11:306. doi: 10.1186/1471-2105-11-306. BMC Bioinformatics. 2010. PMID: 20525384 Free PMC article.
-
Assessing protein conformational sampling methods based on bivariate lag-distributions of backbone angles.Brief Bioinform. 2013 Nov;14(6):724-36. doi: 10.1093/bib/bbs052. Epub 2012 Aug 27. Brief Bioinform. 2013. PMID: 22926831 Free PMC article.
-
Equilibrium simulations of proteins using molecular fragment replacement and NMR chemical shifts.Proc Natl Acad Sci U S A. 2014 Sep 23;111(38):13852-7. doi: 10.1073/pnas.1404948111. Epub 2014 Sep 5. Proc Natl Acad Sci U S A. 2014. PMID: 25192938 Free PMC article.
References
-
- Bishop CM. Pattern recognition and machine learning. Springer; 2006.
-
- Pearl J. Probabilistic reasoning in intelligent systems: networks of plausible inference. Morgan Kaufmann; 1997.
-
- Ghahramani Z. Learning dynamic Bayesian networks. Lect Notes Comp Sci. 1998;1387:168–197. full_text.
-
- Rabiner LR. A tutorial on hidden Markov models and selected applications in speech recognition. Proc IEEE. 1989;77(2):257–286. doi: 10.1109/5.18626. - DOI
-
- Durbin R, Eddy SR, Krogh A, Mitchison G. Biological sequence analysis. Cambridge University Press; 1999.
Publication types
MeSH terms
Substances
LinkOut - more resources
Full Text Sources
Molecular Biology Databases
