. 2010 Mar 12:7:18.
doi: 10.1186/1742-4690-7-18.

GCN5-dependent acetylation of HIV-1 integrase enhances viral integration

Affiliations

GCN5-dependent acetylation of HIV-1 integrase enhances viral integration

Mariaelena Terreni et al. Retrovirology. .

Abstract

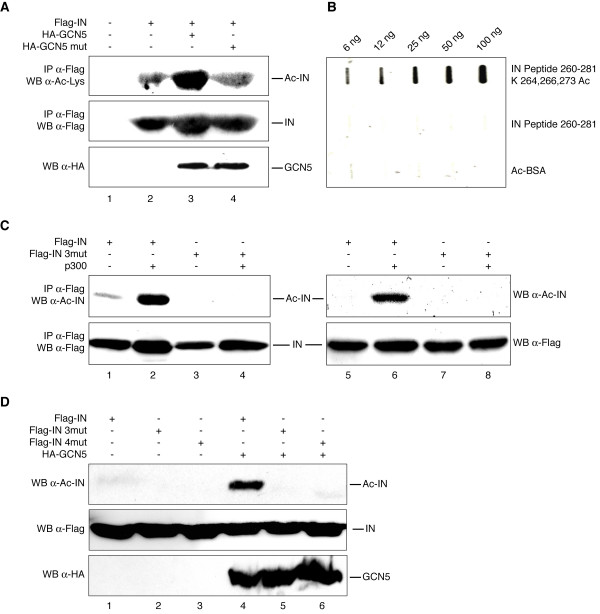
Background: An essential event during the replication cycle of HIV-1 is the integration of the reverse transcribed viral DNA into the host cellular genome. Our former report revealed that HIV-1 integrase (IN), the enzyme that catalyzes the integration reaction, is positively regulated by acetylation mediated by the histone acetyltransferase (HAT) p300.

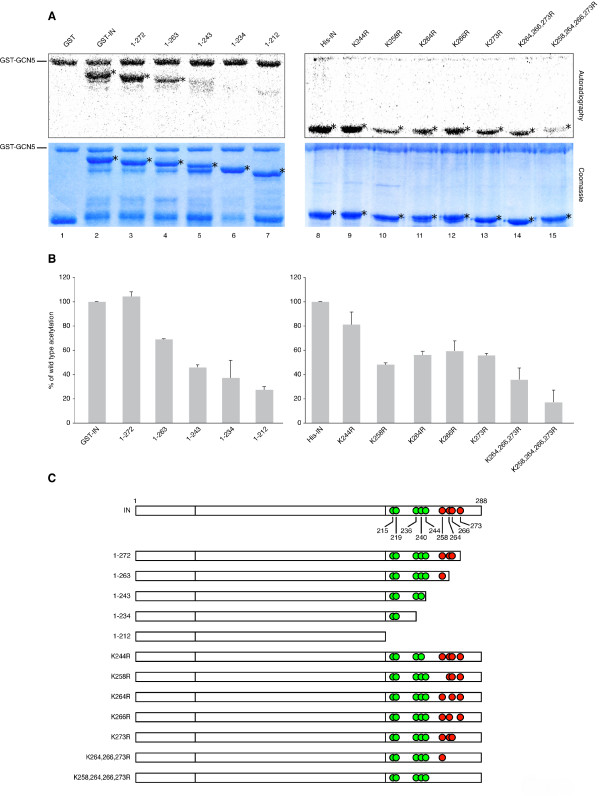
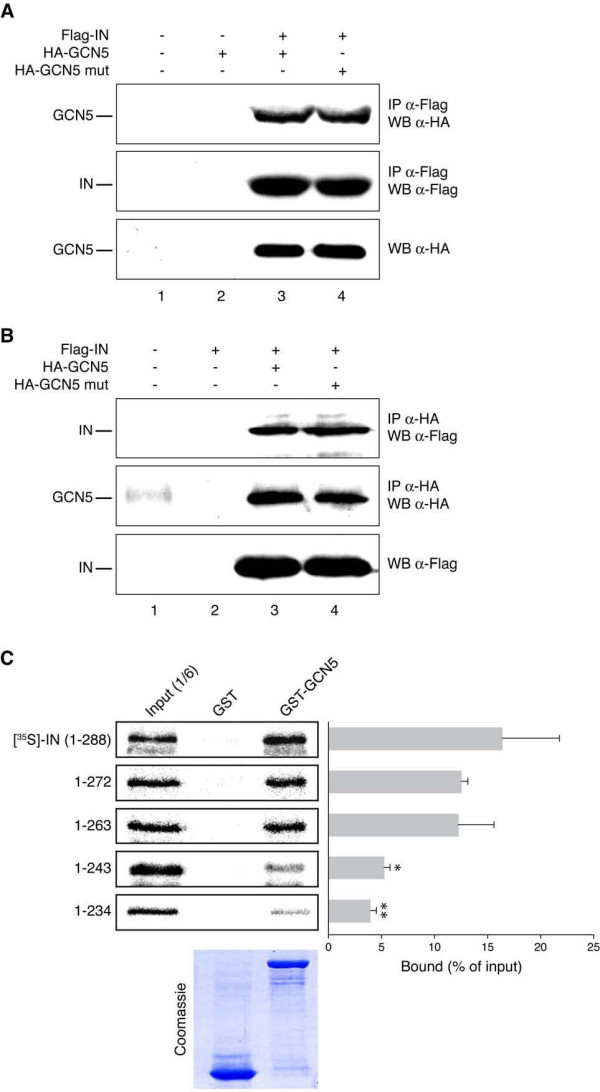
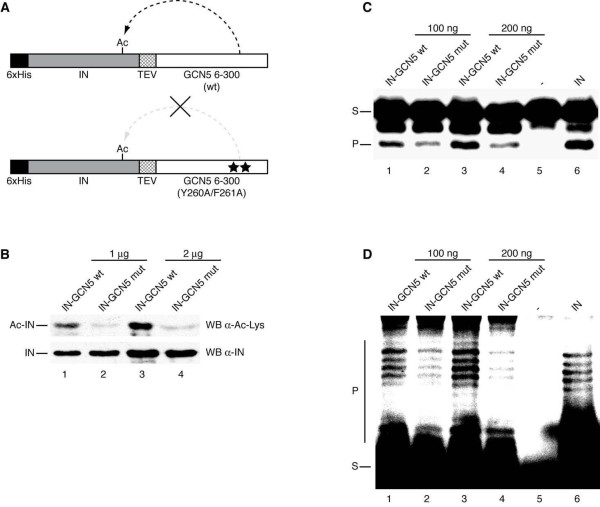
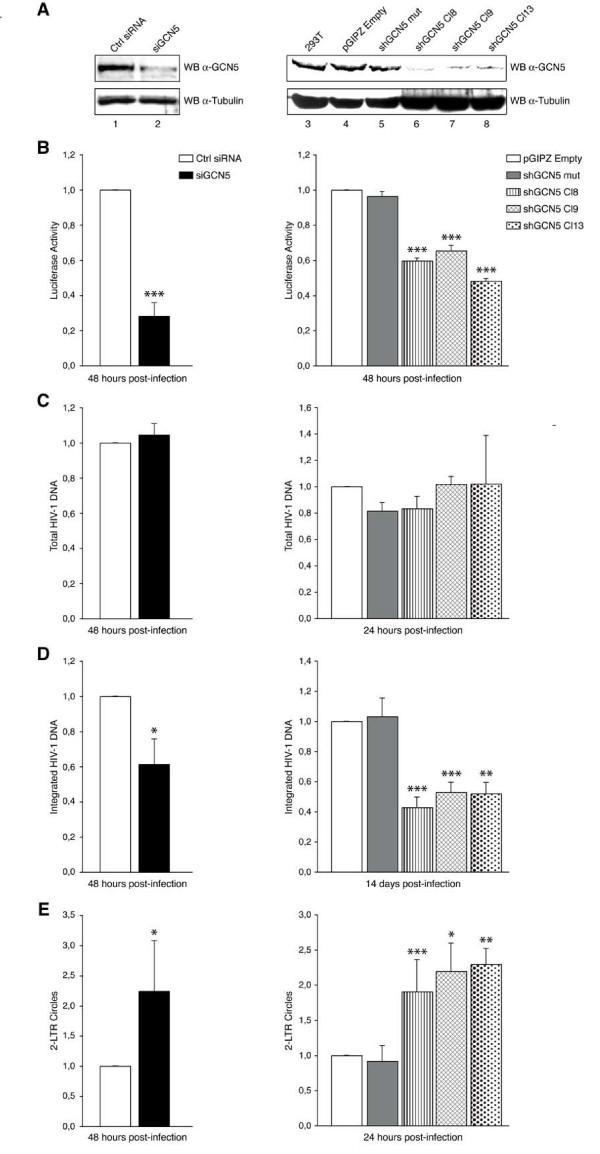
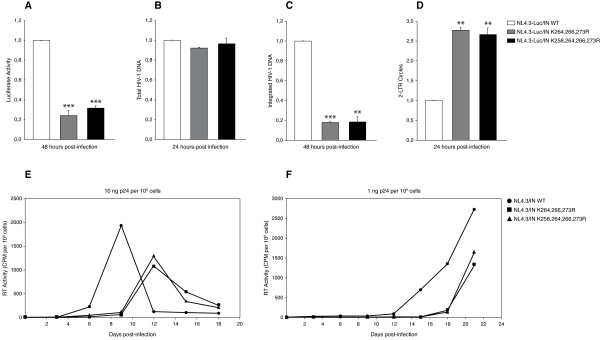
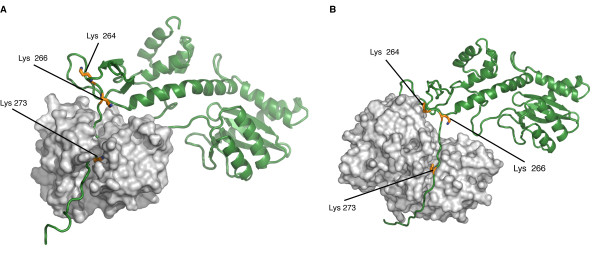
Results: In this study we demonstrate that another cellular HAT, GCN5, acetylates IN leading to enhanced 3'-end processing and strand transfer activities. GCN5 participates in the integration step of HIV-1 replication cycle as demonstrated by the reduced infectivity, due to inefficient provirus formation, in GCN5 knockdown cells. Within the C-terminal domain of IN, four lysines (K258, K264, K266, and K273) are targeted by GCN5 acetylation, three of which (K264, K266, and K273) are also modified by p300. Replication analysis of HIV-1 clones carrying substitutions at the IN lysines acetylated by both GCN5 and p300, or exclusively by GCN5, demonstrated that these residues are required for efficient viral integration. In addition, a comparative analysis of the replication efficiencies of the IN triple- and quadruple-mutant viruses revealed that even though the lysines targeted by both GCN5 and p300 are required for efficient virus integration, the residue exclusively modified by GCN5 (K258) does not affect this process.

Conclusions: The results presented here further demonstrate the relevance of IN post-translational modification by acetylation, which results from the catalytic activities of multiple HATs during the viral replication cycle. Finally, this study contributes to clarifying the recent debate raised on the role of IN acetylated lysines during HIV-1 infection.


Figures

Figure 1
Figure 1
HIV-1 IN is acetylated by GCN5 in vitro. (A) Autoradiography (upper panels) and Coomassie blue staining (lower panels) of in vitro acetylation assay with recombinant GST-GCN5 and IN wild type or mutant proteins. Lanes 1-7: GST fusion IN proteins; lanes 8-15: 6× His-tagged IN proteins. In the Coomassie panels, IN proteins used as acetylation substrates are indicated by asterisks; in the autoradiograms, IN proteins found positive for GCN5-mediated acetylation are indicated in the same way. Presented results are representative data from triplicate in vitro acetylation assay experiments. (B) Results of densitometric analysis of autoradiograms derived from three independent experiments (means ± standard errors of the means [SEM]) expressed as percent wild type IN acetylation. (C) Schematic representation of IN proteins used for the acetylation assays. The positions of lysines in the C-terminal domain of IN are indicated. Lysines positive for acetylation are shown in red.
Figure 2
Figure 2
IN is acetylated by GCN5 in vivo. (A) Extracts from HEK 293T cells transfected with the indicated plasmids were immunoprecipitated using anti-Flag antibody and analyzed by Western blotting with anti-acetyl-lysine antibody (upper panel) or anti-Flag antibody (middle panel). Lower panel: cell extracts immunoblotted with anti-HA antibody. (B) Acetylated BSA and peptides corresponding to IN amino acids 260-281, either chemically acetylated at lysines 264, 266, and 273, or not acetylated, were blotted onto a nitrocellulose filter and incubated with anti-acetylated IN antibody. (C) Left panels (lanes 1-4): extracts from HEK 293T cells transfected with the indicated plasmids were immunoprecipitated using anti-Flag antibody and analyzed by Western blotting with anti-acetylated IN antibody (top panel) or anti-Flag antibody (bottom panel). Right panels (lanes 5-8): extracts from HEK 293T cells transfected with the indicated plasmids analyzed by Western blotting with anti-acetylated-IN antibody (top panel) or anti-Flag antibody (bottom panel). (D) Extracts from HEK 293T cells transfected with the indicated plasmids analyzed by Western blotting with anti-acetylated-IN antibody (upper panel), anti-Flag antibody (middle panel), or anti-HA antibody (lower panel).
Figure 3
Figure 3
IN interacts with GCN5 both in vitro and in vivo. (A) Extracts from HEK 293T cells transfected with the indicated plasmids were immunoprecipitated using anti-Flag antibody and analyzed by Western blotting with anti-HA antibody (upper panel) or anti-Flag antibody (middle panel). Lower panel: extracts immunoblotted with anti-HA antibody. (B) Extracts from HEK 293T cells transfected with the indicated plasmids were immunoprecipitated using anti-HA antibody and analyzed by Western blotting with anti-Flag antibody (upper panel) or anti-HA antibody (middle panel). Lower panel: extracts immunoblotted with anti-Flag antibody. (C) Autoradiography and Coomassie Blue staining of in vitro binding assays with GST-GCN5 and 35S-IN or the indicated 35S-IN fragments. The histogram represents the results of three independent experiments (means ± SEM), where the amounts of bound proteins are expressed as percentages of the corresponding radiolabeled inputs. Statistical significance of the binding percentages was calculated by using the Student's two-sided t test. Asterisks directly above bars indicate differences in binding efficiency to GST-GCN5 between IN deleted forms and full-length IN. **, P < 0,01; *, P < 0,05. Conversely, where asterisks are not present, values obtained did not significantly differ (P > 0,05) from those obtained with control, non-silenced cells.
Figure 4
Figure 4
GCN5-mediated acetylation increases the catalytic activity of IN. (A) Schematic representation of IN-GCN5 tethered catalysis constructs. Full-length IN, tagged with a N-terminal 6× His epitope, is fused in frame with TEV proteolytic site and cloned upstream of the 6-300 amino acid region of wild type GCN5 (IN-HAT wt) or its catalytically inactive allele (IN-HAT mut). (B) 1 μg and 2 μg of IN derived from IN-HAT wt (lanes 1 and 3, respectively), or 1 μg and 2 μg of IN derived from IN-HAT mut (lanes 2 and 4, respectively) were analyzed by Western blotting with anti-acetyl-lysine antibody (top panel) or anti-IN antibody (bottom panel). (C) 3' -end processing activity of IN derived from IN-HAT wt (lane 1: 100 ng; lane 3: 200 ng) or IN-HAT mut (lane 2: 100 ng; lane 4: 200 ng). Lane 5: DNA substrate; lane 6: DNA substrate with 40 ng of 6× His-tagged IN. (D) Strand transfer activity of IN derived from IN-HAT wt (lane 1: 100 ng; lane 3: 200 ng) or IN-HAT mut (lane 2: 100 ng; lane 4: 200 ng). Lane 5: DNA substrate; lane 6: DNA substrate with 40 ng of 6× His-tagged IN. In (C) and (D), the DNA substrate (S) and the catalytic products (P) are indicated.
Figure 5
Figure 5
GCN5 depletion in infected cells reduces HIV-1 integration. (A) Left panels: extracts from siRNA-treated Hela cells analyzed by Western blotting with anti-GCN5 antibody (top) or anti-α-tubulin antibody (bottom). Lane 1: cells transfected with non-targeting siRNA (Ctrl siRNA); lane 2: cells transfected with GCN5-targeting siRNA (siGCN5). Right panels: extracts from stable GCN5 knockdown HEK 293T cell clones or control cells immunoblotted with anti-GCN5 antibody (top panel) or anti-α-tubulin antibody (bottom panel). Lane 3: untransduced HEK 293T cells; lane 4: HEK 293T cells carrying empty pGIPZ vector; lane 5: HEK 293T cells expressing mutant, non-targeting GCN5 shRNAmir; lanes 6-8: HEK 293T clones (Cl8, Cl9 and Cl13) expressing GCN5 shRNAmir. (B) siRNA-treated Hela cells (left histogram) or HEK 293T cells stably transduced with pGIPZ lentiviral vectors (right histogram) were infected with NL4.3-Luc and analyzed for luciferase activity 48 hours after infection. The histograms represent percentages of luciferase activity relative to control, non-silenced cells. Means ± SEM from three independent experiments are reported. (C-E) Total DNA extracted from siRNA-treated HeLa cells (left histograms) or HEK 293T cells stably transduced with pGIPZ lentiviral vectors (right histograms) was analyzed by RT-Q-PCR for total HIV-1 DNA (C), integrated HIV-1 DNA (D), and two-LTR circles (E). In (C-E), results are presented as percentages relative to control, non-silenced cells. Reported values are means ± SEM from three independent experiments. Statistical significance values shown in (B-E) were calculated by using the Student's two-sided t test. Asterisks directly above bars indicate differences between knockdown and control, non-silenced cells. ***, P < 0,001; **, P < 0,01; *, P < 0,05. Conversely, where asterisks are not present, values obtained did not significantly differ (P > 0,05) from those obtained with control, non-silenced cells.
Figure 6
Figure 6
Mutations at IN acetylation sites cause a replication defect at the step of integration. (A) HEK 293T cells infected with NL4.3-Luc/IN WT, NL4.3-Luc/IN K264,266,273R, or NL4.3-Luc/IN K258,264,266,273R were analyzed for luciferase activity 48 hours after infection. (B-D) Total DNA extracted from HEK 293T cells infected with the same viral clones as in (A) was analyzed by RT-Q-PCR for total HIV-1 DNA at 24 hours after infection (B), integrated HIV-1 DNA at 48 hours after infection (C) and two-LTR circles at 24 hours after infection (D). In (A-D), results are presented as percentages relative to cells infected with NL4.3-Luc/IN WT virus. Reported values are means ± SEM from three independent experiments. Statistical significance values shown in (A-D) were calculated by using the Student's two-sided t test. Asterisks directly above bars indicate differences between cells infected with mutant viruses and cells infected with wild type virus. ***, P < 0,001; **, P < 0,01. Conversely, where asterisks are not present, values obtained did not significantly differ (P > 0,05) from those obtained with cells infected with wild type virus. (E) RT activity detected in the culture supernatants of CEM cells at different time points after infection with NL4.3/IN WT, NL4.3/IN K264,266,273R, or NL4.3/IN K258,264,266,273R. (F) Infections performed as in (E), using 10-fold lower viral loads.
Figure 7
Figure 7
Three-dimensional models of IN complexes with GCN5 and p300. (A) Three-dimensional model of the IN/GCN5 complex. IN is represented in green and GCN5 in light grey. (B) Three-dimensional model of the IN/p300 complex. IN is represented in green and p300 in light grey. In (A) and (B), the three lysine residues in the C-terminal domain of IN that are acetylated by both GCN5 and p300 (Lys 264, Lys 266, and Lys 273) are shown in yellow. GCN5 and p300 are rendered as surfaces, while IN as a cartoon to highlight the C-terminal unfolded portion which inserts in the binding pockets of the two HATs.

Similar articles

Cited by

References

    1. Cereseto A, Manganaro L, Gutierrez MI, Terreni M, Fittipaldi A, Lusic M, Marcello A, Giacca M. Acetylation of HIV-1 integrase by p300 regulates viral integration. Embo J. 2005;24:3070–3081. doi: 10.1038/sj.emboj.7600770. - DOI - PMC - PubMed
    1. Topper M, Luo Y, Zhadina M, Mohammed K, Smith L, Muesing MA. Posttranslational acetylation of the human immunodeficiency virus type 1 integrase carboxyl-terminal domain is dispensable for viral replication. J Virol. 2007;81:3012–3017. doi: 10.1128/JVI.02257-06. - DOI - PMC - PubMed
    1. Carrozza MJ, Utley RT, Workman JL, Cote J. The diverse functions of histone acetyltransferase complexes. Trends Genet. 2003;19:321–329. doi: 10.1016/S0168-9525(03)00115-X. - DOI - PubMed
    1. Roth SY, Denu JM, Allis CD. Histone acetyltransferases. Annu Rev Biochem. 2001;70:81–120. doi: 10.1146/annurev.biochem.70.1.81. - DOI - PubMed
    1. Yang XJ, Seto E. HATs and HDACs: from structure, function and regulation to novel strategies for therapy and prevention. Oncogene. 2007;26:5310–5318. doi: 10.1038/sj.onc.1210599. - DOI - PubMed

Publication types

Substances

LinkOut - more resources