. 2010 Mar 23;20(6):487-95.
doi: 10.1016/j.cub.2010.02.027. Epub 2010 Mar 11.

A hormone-activated central pattern generator for courtship

Affiliations

A hormone-activated central pattern generator for courtship

Daniel A Wagenaar et al. Curr Biol. .

Abstract

Background: Medicinal leeches (Hirudo spp.) are simultaneous hermaphrodites. Mating occurs after a stereotyped twisting and oral exploration that result in the alignment of the male and/or female gonopores of one leech with the complementary gonopores of a partner. The neural basis of this behavior is presently unknown and currently impossible to study directly because electrophysiological recording techniques disrupt the behavior.

Results: Here we report that (Arg(8))-conopressin G and two other members of the oxytocin/vasopressin family of peptide hormones induce in Hirudo verbana a sequence of behaviors that closely mimic elements of spontaneous reproductive behavior. Through a series of progressively more reduced preparations, we show that one of these behaviors, a stereotyped twisting that is instrumental in aligning gonopores in preparation for copulation, is the product of a central pattern generator that consists of oscillators in ganglia M5 and M6 (the ganglia in the reproductive segments of the leech), and also in ganglion M4, which was not previously known to play a role in reproductive behavior. We find that the behavior is periodic, with a remarkably long cycle period of around five minutes, placing it among the slowest behavioral rhythms (other than diurnal and annual rhythms) yet described.

Conclusion: These results establish the leech as a new model system for studying aspects of the neuronal basis of reproductive behavior.


Figures

Figure 1
Figure 1
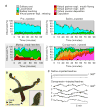
Spontaneous behavior of mating-ready leeches. A. Ethogram of the five main behavioral states of mating-ready leeches. The areas of the circles are proportional to the percentage of time spent in that state (numbers inside circles). The thickness of the arrows represents the likelihood of transitioning from one state to another (numbers by arrows: percent transitions per 5-minute observational timestep; an arrow from a circle back to itself indicates continuation of that behavior into the next 5-minute window). Data from 10 pairs of leeches that were observed for 100 minutes each. B. Typical longitudinal twisting during partner exploration. The heads, tails, and genital areas of both animals are indicated by yellow, blue, and red arrows. C. Copulation. Note the precise alignment of the genital areas and the flattening of the surrounding portion of the body.
Figure 2
Figure 2
Behavior of conopressin-injected leeches. A. Fraction of time leeches spent performing each of 6 behaviors after injection with conopressin (n=16) or saline (n=18) as a function of time after injection. The “Pre-injection” panel combines data from both experimental and control groups. (Time is measured from the moment the animals were first placed in the observation tank.) Virtual partner exploration (“expl.” in legend) was seen only after injection with conopressin. We here distinguish between twisting (yellow) and mouth flaring (red). These two components of the exploration behavior commonly occurred together (hatched yellow/red). Inset: Data on mating-ready leeches replotted from Fig. 1A, for comparison. (Colors as in other panels, but yellow indicates actual, rather than virtual, partner exploration.) B. Typical longitudinal twisting of conopressin-injected leeches. Despite the fact that the posterior ends of these animals cross, their anterior ends never interacted with one another. Inset: Closeup of the anterior part of a leech with its mouth open and flared. C. Temporal pattern of longitudinal twisting: twisting angle as a function of time for 5 conopressin-injected leeches and 3 saline-injected controls.
Figure 3
Figure 3
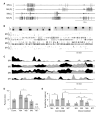
Kinematics of a semi-intact body wall during conopressin-induced twisting. A. Frame from a body wall videorecording with anatomical features indicated. Shaded regions are dorsal (D) and ventral (V) areas on the left (l) and right (r) sides of segments M5 and M6 that were used for motion analysis. (For visual clarity, areas 5D(r), 5V(l), 6D(l) and 6V(r) are not indicated on the image, although they were included in the analysis.) B. Temporal pattern of longitudinal elongation and contraction of the dorsal body wall on the left (gray line: area 6D(l)) and right (black line: area 6D(r)) around M6 in a typical “ci-6” recording. Note the alternation between contractions on the left and on the right. C. Same data after low-pass filtering. D. Expanded view of the shaded region in B after high-pass filtering. E. Temporal correlation between the lengths of various regions (patterned shading) of the body wall within a segment (M5: white bars; M6: gray bars). All are with reference to one (“ipsilateral”) dorsal region in the same sgment. Movements were analyzed on the slow time scale, i.e., the low-pass filtered as in C, and significant differences from zero are indicated: *: p<0.05; **: p<0.01; ***: p<0.001 (two tailed t-tests). F. Excerpt from the data shown in B demonstrating that the amplitude of the fast pulses was greater during the contraction phase of the slow rhythm than during its relaxation. G. Correlation between the amplitude of the fast rhythm (cf. B, D) with the simultaneously measured overall length of the same region (analyzed on the slow time scale, cf. C). Number of preparations (in parentheses) applies to E as well. An analogous presentation of the contractile rhythm in the circumferential dimension is presented in Supplemental Figure S1.
Figure 4
Figure 4
Motor neuron activity in a conopressin-bathed nerve cord. A. Simultaneously recorded sample traces of conopressin-induced motor neuron activity. The largest spikes (marked by dots below the traces) correspond to action potentials in motor neuron DE-3. B. Raster plot of a longer portion of the same recording. Each dot corresponds to an action potential in the left (L) or right (R) motor neuron DE-3 in one of the four ganglia around the genital area. Data shown were recorded simultaneously in a single trial (rather than by post-hoc alignment of multiple independent recordings); vertical placement of dots within each band was randomized to enhance visual clarity. Insets: 10x zooms showing left–right coordination of bursts when the activity was in right-dominant and left-dominant modes. C. Normalized firing rate of the left (gray) and right (black) motor neurons DE-3 in each ganglion; same recording as shown in B. Scale bars: 0.2 spikes/s for M4, M7; 2.0 spikes/s for M5, M6. D. Periods of the conopressin-induced slow left–to–right oscillations in the firing rates of motor neurons DE-3, in chains containing all of M4–M7 (“Conn.”) and in ganglia (“M4”–“M7”) disconnected from the (other) reproductive ganglion. Stars inside bars indicate significant differences in connected chains vs. disconnected chains; stars over brackets indicate significant differences between ganglia. Numbers in parentheses indicate number of preparations. Motor neurons DE-3 in isolated ganglia M7 had near-zero firing rates, so their period could not be measured in a meaningful way (indicated by “n.m.”). E. Amplitude of the oscillations described in D. Stars inside bars indicate significant deviations from zero (see Methods). Analogous data from nerve cords bathed in saline and hirudotocin are presented in Supplemental Figure S2.
Figure 5
Figure 5
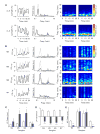
Spectral analysis of body wall movements and fictive behavior. A. Analysis of body wall movements. Left column: Contractions and relaxations in left (black) and right (gray) dorsal areas in the segment with attached ganglion (low-pass filtered). Second column: Power spectrum of the contractions (DC baseline subtracted). Third and fourth columns: spectrogram of contractions in the left and right dorsal areas (high-pass filtered with f0 = 0.5/min). The “ci-5” data (top row) and “ci-6” data (bottom row) are from separate experiments. B. Analysis of fictive behavior of a chain of ganglia M3–M8 bathed in conopressin. Left column: firing rate in left (black) and right (gray) DP1 nerves of ganglia M4 through M7 (top to bottom; low-pass filtered). Second column: Power spectrum of the firing rate (DC baseline subtracted). Third and fourth columns: spectrogram of firing rates in the left and right DP1 nerves (high-pass filtered with f0 = 0.5/min). All rows based on simultaneously recorded data, but note the different vertical scales for each row. C. Spectral power in the frequency band corresponding to the 5-minute rhythm (f = 0.15–0.25/min) in saline (white) and conopressin (gray). Data from 18, 26, 28, 16 nerves from M4, M5, M6, M7 respectively. *: p<0.05, two-tailed t-test. D. Real part of the coherence between left and right nerve activity in this band. Data from 9, 13, 14, 8 nerve pairs from M4, M5, M6, M7 respectively. ***: p<0.001. E. Spectral power in the frequency band corresponding to the bursts (f = 1–10/min). Statistics as for C; **: p<0.01. Analogous data from nerve cords bathed in saline and hirudotocin are presented in Supplemental Figure S3.

Comment in

Similar articles

Cited by

References

    1. Insel TR, Young L, Wang Z. Central oxytocin and reproductive behaviours. Rev Reprod. 1997;2:28–37. - PubMed
    1. Ball GF, Balthazar J. Ethological concepts revisited: immediate early gene induction in response to sexual stimuli in birds. Brain Behav Evol. 2001;57:252–270. - PubMed
    1. Greenspan RJ, Ferveur JF. Courtship in Drosophila. Annu Rev Genet. 2000;34:205–232. - PubMed
    1. Barr MM, Garcia LR. Male mating behavior. WormBook. 2006:1–11. - PMC - PubMed
    1. Fisher H, Aron A, Brown LL. Romantic love: an fMRI study of a neural mechanism for mate choice. J Comp Neurol. 2005;493:58–62. - PubMed

Publication types

MeSH terms

LinkOut - more resources