. 2010 Mar 26;32(3):355-66.
doi: 10.1016/j.immuni.2010.02.013. Epub 2010 Mar 11.

Single round of antigen receptor signaling programs naive B cells to receive T cell help

Affiliations

Single round of antigen receptor signaling programs naive B cells to receive T cell help

Bazarragchaa Damdinsuren et al. Immunity. .

Abstract

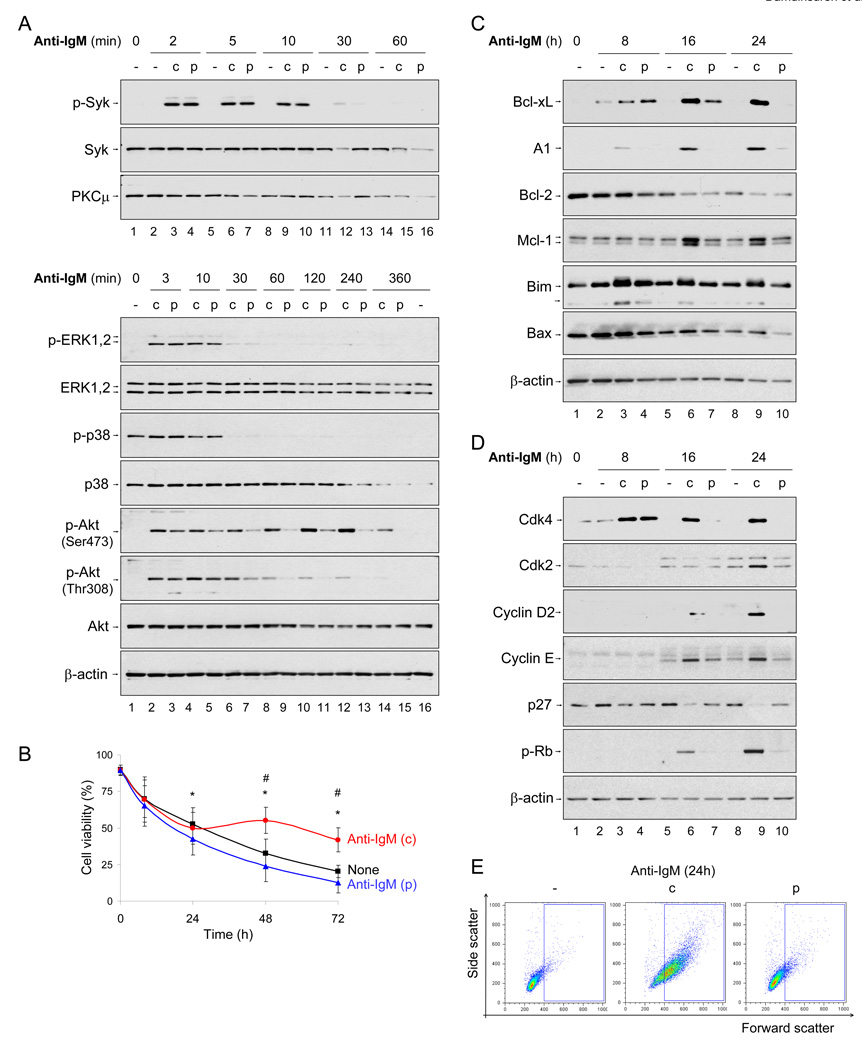
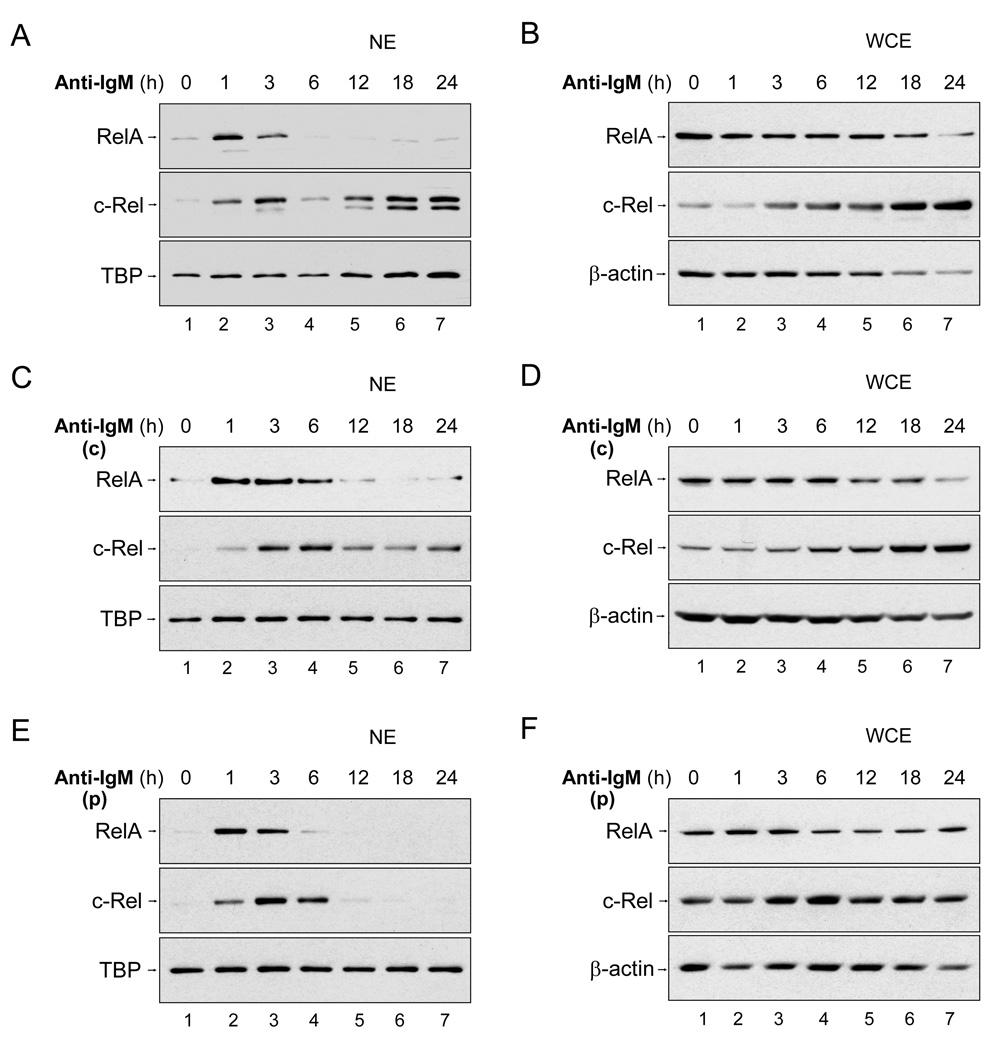
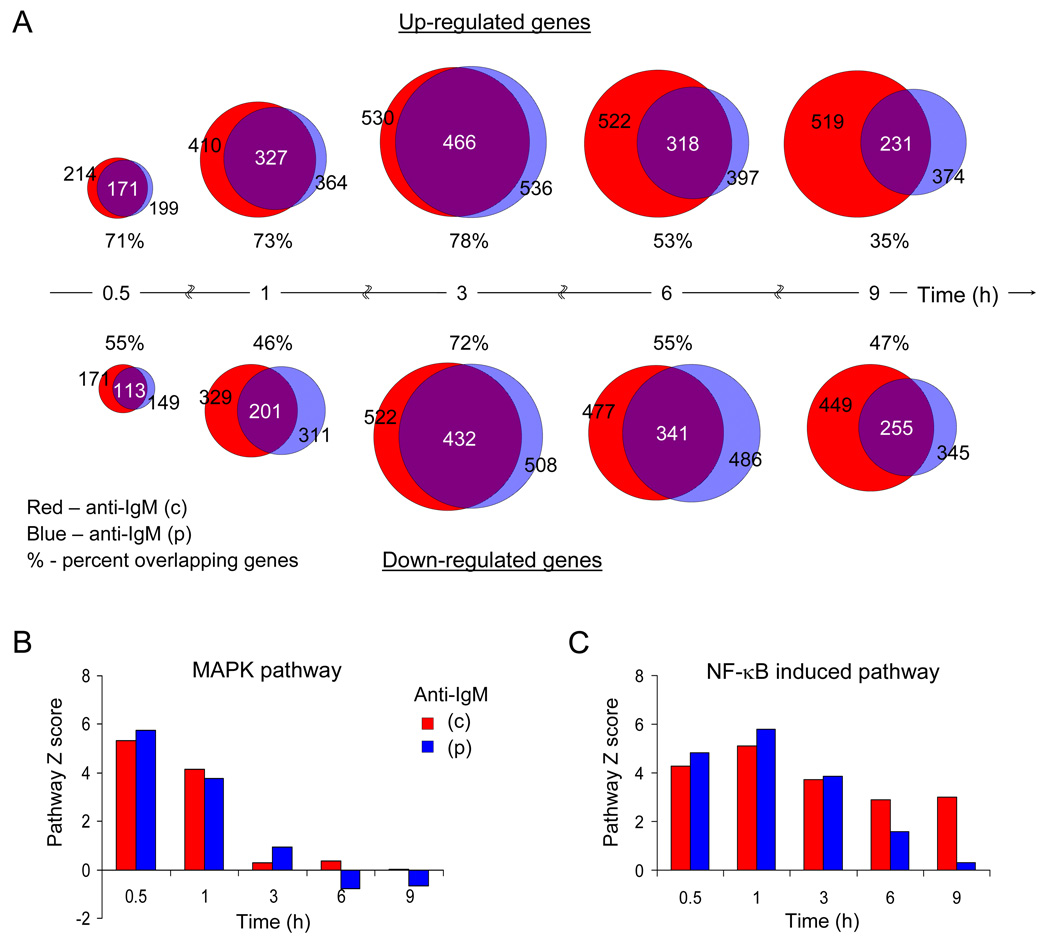
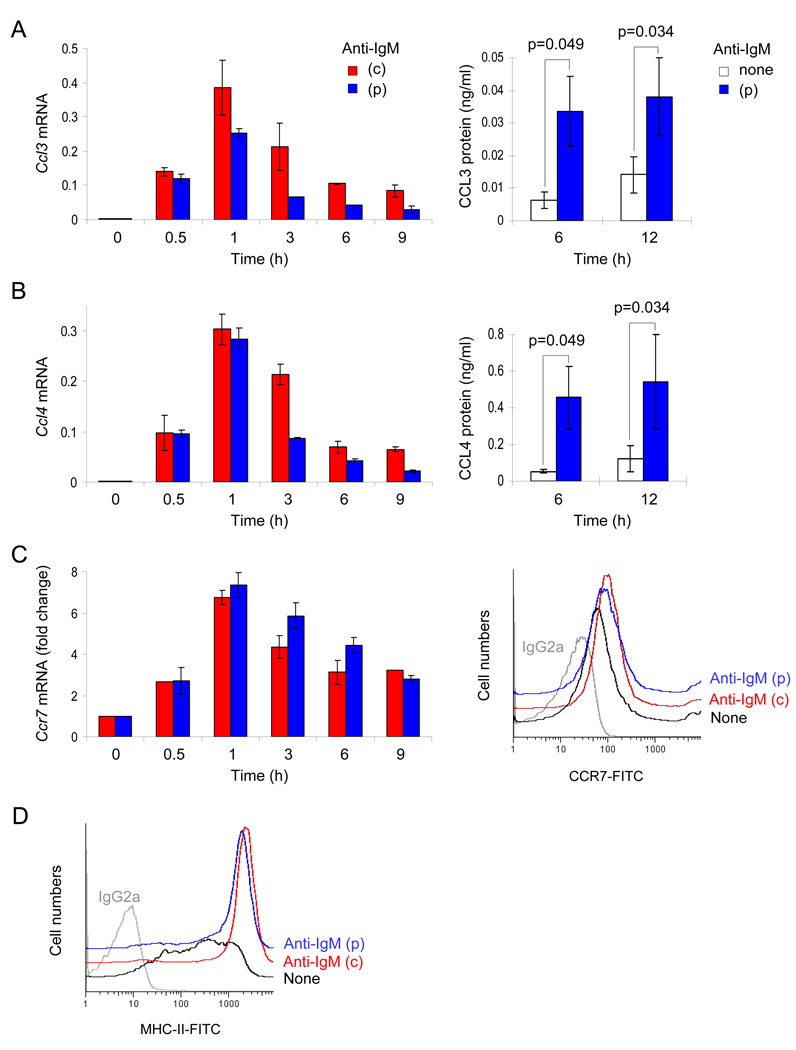
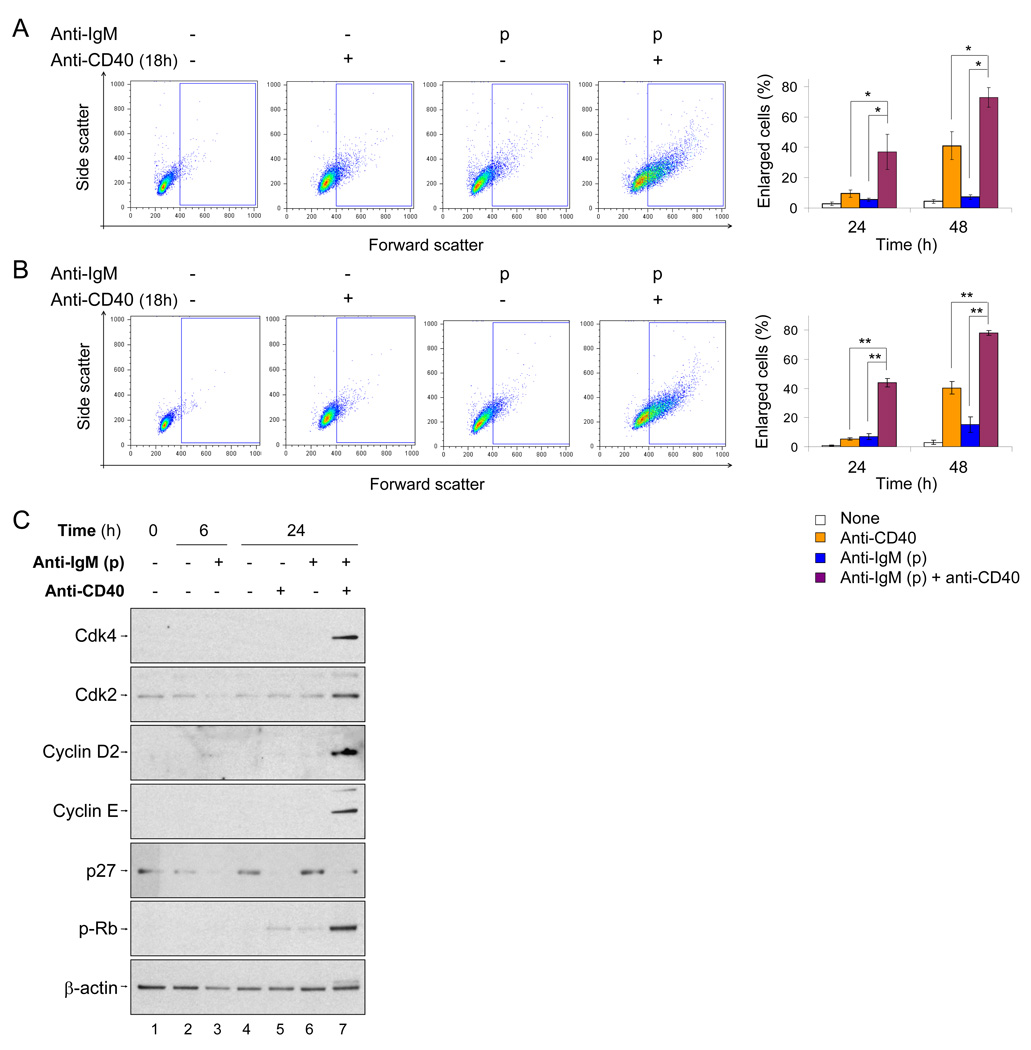
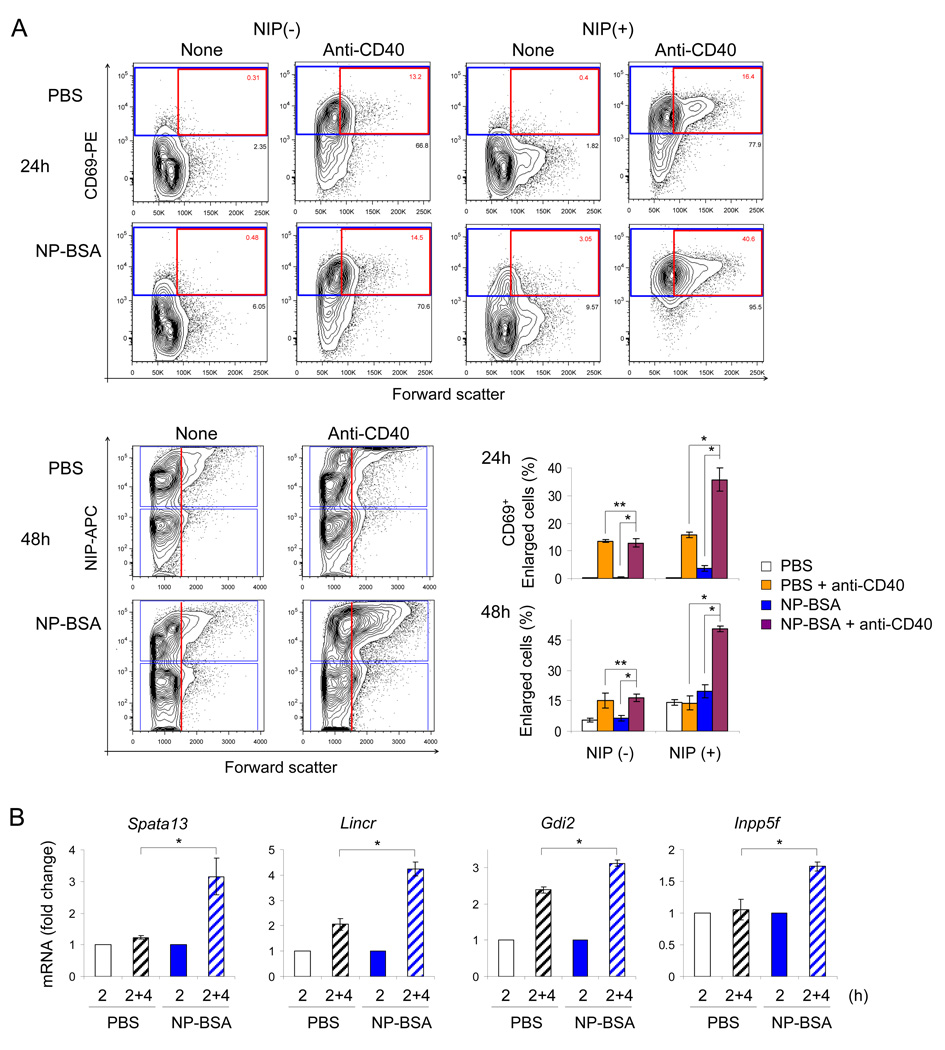
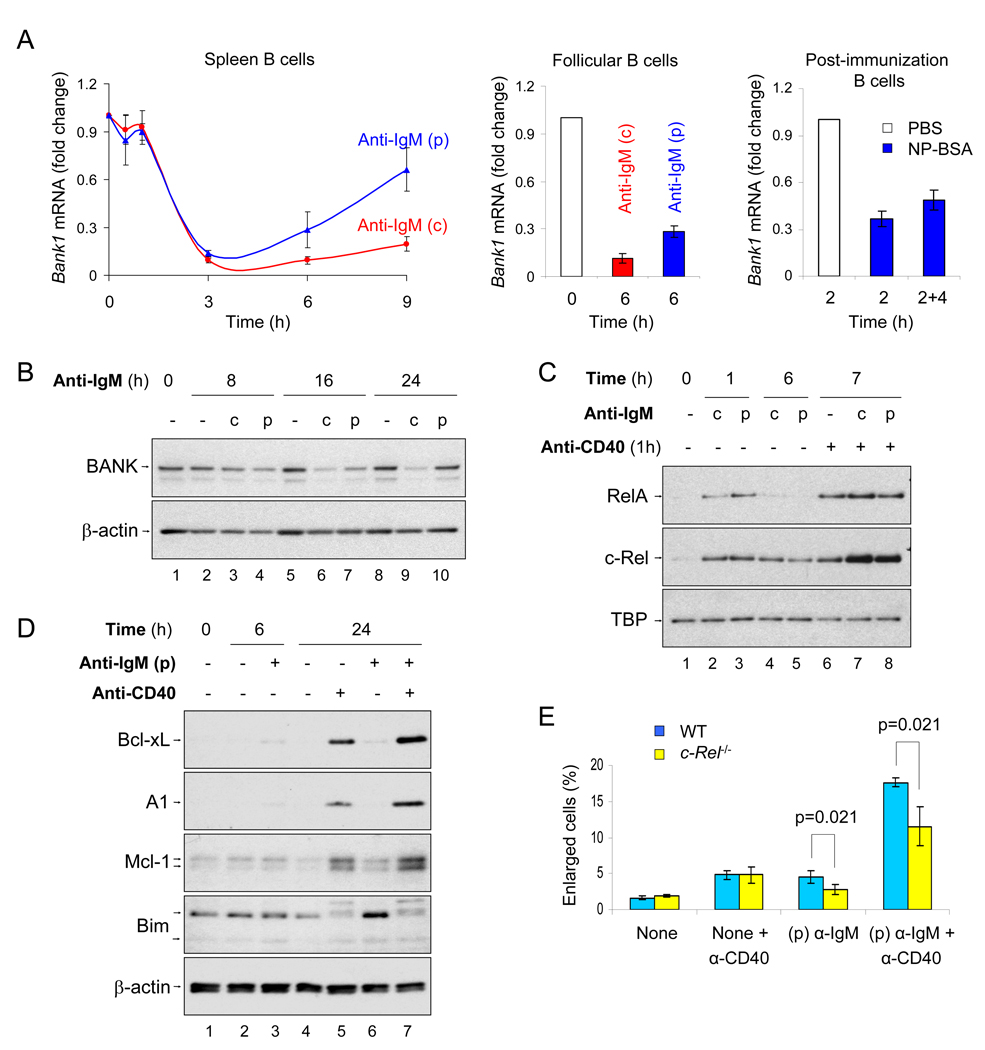
To simulate transient B cell activation that is the likely initiator of T-dependent responses, we examined the molecular and functional consequences of a single round of immunoglobulin M (IgM) signaling. This form of activation triggered early cytosolic signaling and the transcription factor NF-kappaB activation indistinguishably from conventional continuous IgM crosslinking but did not induce G1 progression. However, single round IgM signaling changed the expression of chemokine and chemokine receptor genes implicated in initiating T-dependent responses, as well as accentuated responsiveness to CD40 signaling. Several features of single-round IgM signaling in vitro were recapitulated in B cells after short-term exposure to antigen in vivo. We propose that transient BCR signals prime B cells to receive T cell help by increasing the probability of B-T encounter and creating a cellular environment that is hyper-responsive to CD40 signaling.


Figures

Fig. 1
Fig. 1. Pulsed activation induces cell death without G1 progression
Purified spleen B cells were activated according to the scheme shown in Fig. S1A. For pulsed (single-round) BCR activation, cells were incubated with F(ab')2 anti-IgM (10µg/ml) on ice for 30 minutes, washed with cold PBS, re-suspended in fresh cold medium and moved to a 37°C incubator. At various times thereafter viability was determined by propidium iodide (PI) exclusion with flow cytometry (B) or whole cell extracts (WCE) prepared for protein analyses (A, C and D). For continuous activation anti-IgM was bound to cells on ice for 30 minutes and then moved directly to 37°C without intermediate washing steps. A) Early signal transduction in pulse (p) and continuously (c) activated cells. WCE prepared at times shown above the lanes were examined by immunoblotting. “p” prefix denotes the phosphorylated form of the kinase. Protein loading was normalized against PKCμ or β-actin. Data shown are representative of 3 independent experiments. B) Cell viability (Y axis) after pulsed (p, blue line), continuous (c, red line) or no anti-IgM (black line) treatment was determined by PI exclusion at the times indicated (X axis). Data shown is the average of 9 independent experiments. Error bars represent the standard deviation (SD) between experiments. * p=0.017, p=0.013 and p=0.034 between pulsed and no anti-IgM at 24, 48 and 72h time points, respectively. # p<0.001 between continuous and none anti-IgM treatment at 48 and 72h by Mann-Whitney U test. C) Pro- and anti-apoptotic protein expression in activated B cells. WCE from pulse (p) or continuously (c) activated cells prepared at the indicated times were immunoblotted with antibodies against anti-apoptotic Bcl-2 family proteins, or BH3-only proteins. Data shown are representative of 3 independent experiments. D) Molecular analysis of cell cycle progression. B cells were activated by pulse (p) or continuous (c) anti-IgM treatment, and cell cycle progression followed by analysis of molecular markers of G1 progression by immunoblotting of WCE. Representative blots of 3 independent experiments are shown. E) G1 progression analysis by cell size. Live B cells were analyzed by forward and side scatter to estimate frequency of enlarged cells (Fig. S1B). Representative flow cytometry pattern at 24h time point is shown. The average of 6 independent experiments is shown in Fig. S1C.
Fig. 2
Fig. 2. Pulsed activation induces only phase I NF-κB
B cells were activated by anti-IgM using three schemes as described below. At various times after activation nuclear extracts (NE) or WCE were prepared as outlined in Experimental Procedures, assayed by immunoblotting using antibodies against NF-κB family members, RelA and c-Rel, as indicated. TATA-binding protein (TBP) and β-actin were used as the loading controls for NE and WCE, respectively. A, B) Anti-IgM was added to B cells maintained at 37°C to imitate conventional continuous anti-IgM activation. At the indicated times protein extracts were prepared and analyzed by immunoblotting. Analysis of corresponding WCE for IκB expression is shown in Fig. S2A. C – F) B cells were treated with anti-IgM at 4°C for 30 min and then raised to 37°C with, or without, washing to remove excess unbound anti-IgM to initiate pulse (p, in E and F) or continuous (c, in C and D) activation (see scheme in Fig. S1A). Data shown is representative of 3 independent experiments with each activation protocol. IκB expression in corresponding WCE is shown in Fig. S2B and C, and quantitation of bi-phasic c-Rel activation in Fig. S2D.
Fig. 3
Fig. 3. Pulse activation causes long-term changes in gene expression
A) B cells were activated with pulsed or continuous anti-IgM according to the scheme in Fig. S1A. Total RNA isolated at the indicated times was converted to cDNA and hybridized to 22K Illumina arrays as detailed in Experimental Procedures. At each time point statistically significant genes that were up- (top row) or down-regulated (bottom row) in response to anti-IgM were compared between pulse- (p) or continuously (c) activated cells. Blue and red circles represent the mRNAs that are changed as a consequence of pulsed or continuous anti-IgM treatment, respectively; the size of circles is proportional to the numbers of genes in each pool as indicated, and the extent of overlap represents changes that were common to both forms of stimulation. The number of shared genes between the two forms of activation is shown in the overlap. The percentage of altered mRNAs shared between pulse- and continuously- activated cells is indicated below the circles. Data shown is derived from 3 independent experiments. See Table S1 for gene expression data. B, C) The RNA data from part A was analyzed using Ingenuity Pathway analysis software. The pathway Z scores for MAPK associated and NF-κB-induced mRNAs relative to unactivated cells is shown (Y axis) as a function of time (X axis) for pulse (blue bars) and continuous (red bars) activation regimens.
Fig. 4
Fig. 4. Pulse activation induces chemokines and cell surface receptors involved in B-T interaction
A, B) B cells were activated with pulse (p) or continuous (c) anti-IgM stimulation. At various times after initiation of signaling, Ccl3 (A), Ccl4 (B) mRNA and secreted proteins were examined by qRT-PCR (see also Fig. S3) or ELISA, respectively. Ccl3 and Ccl4 mRNAs were normalized to Actin mRNA. Data shown is the average of 2 independent RNA time-course experiments with RT-PCR assays being carried out in duplicates. For analysis of secreted chemokines, culture medium from untreated or pulse-treated B cells were collected at 6 and 12h time points. CCL3 and CCL4 protein was detected by ELISA. Data shown is the average ±SD of 3 independent experiments. P values were calculated by Mann-Whitney U test. C) Ccr7 mRNA expression was examined by qRT-PCR as described in parts A and B; Y axis indicates the fold increase in normalized Ccr7 mRNA expression compared to 0h. To detect cell surface expression of CCR7 protein, cells were harvested at 24h after activation and immunostained using CD197-FITC antibody. Data shown is representative of 3 independent experiments. Median fluorescence intensities (MFI) of CCR7 expression for unactivated (black), continuously (red) - and pulsed (blue) -activated cells were 56.5±7.7, 91±14.1 and 86±1.4, respectively. D) Cell surface expression of MHC-II protein. Cells were harvested at 12h after pulsed- or continuous-activation, stained and analyzed by flow cytometry. Data shown is representative of 3 independent experiments. MFIs of MHC-II expression for unactivated (black), continuously (red) - and pulsed (blue) -activated cells were 269±74, 2320±179 and 1544±83, respectively.
Fig. 5
Fig. 5. Pulse activation primes B cells to respond to CD40 signals
B cells were left untreated- or pulse-activated (p) at 0h. 6h later anti-CD40 was added to both cultures, and 18h later cells harvested to assay G1 progression by flow cytometry and molecular markers (Fig. S4A). A) Representative flow cytometric analysis of CD40 responsiveness of pulse-activated cells gated on live cells. Enlarged cells compared to the starting naïve B cell population were scored as described in Fig. S1B. Bar graph shows the average of 8 independent blast formation experiments represented as the percentage of cells that fall in the enlarged cell gate. Bars represent average ± SD between experiments. * indicate p<0.001 between treatments by Mann-Whitney U test. B) Sorted follicular B cells (Fig. S4D) were activated by pulse (p) anti-IgM and anti-CD40, and cell cycle progression followed by cell size using flow cytometry. Representative flow cytometry pattern after 18h anti-CD40 treatment is shown. Bar graphs the average ±SD of 3 experiments. ** indicate p<0.01 between treatments by Mann-Whitney U test. C) WCEs prepared from cells activated according to the scheme described above, were blotted with antibodies against the G1 phase markers. Data shown is representative of 3 independent experiments.
Fig. 6
Fig. 6. In vivo B cell priming
mIgM-Tg mice were injected intravenously with PBS alone (2 animals) or 250µg NP-BSA in PBS (3 animals), 2h later splenic B cells were isolated, incubated ex vivo for 4h, followed by anti-CD40 treatment. RT-PCR assays and flow cytometry analyses are performed at indicated time points (see experiment scheme in Fig. S5D). A) Representative flow cytometric analysis of B cells at 24h (top panels) and 48h (bottom panels) after animal immunization and ex vivo culture with or without anti-CD40. Antigen-specific B cells were detected using fluoresceinated NIP ((4-hydroxy-3-nitro-2-iodophenyl)acetyl). For 24h analysis NIP(−) and NIP(+) alive B cells were further scored for CD69 expression and cell size by forward scatter. Cells that were not treated with anti-CD40 are marked ‘none’, and their origin from PBS-injected or NP-BSA-injected is indicated on the left. Gating for CD69+ cells is shown by the blue box and for enlarged cells by the red box. For 48h analysis cells were analyzed for antigen specificity (blue boxes) and cell size increase (red line). Graphs for the 24h or 48h time points show percent of enlarged, CD69+ cells (red box) or frequency of enlarged cells (falling to the right of the red line) among NIP-binding or not binding cells. Bar graphs represent the average ±SD between individual animals in each treatment arm. * indicates p<0.05, ** indicates p>0.05 as determined by Mann-Whitney U test. B) Induction of pulse anti-IgM specific genes. B cells were purified from spleen of NP-BSA or PBS injected mice 2h after immunization. RNA was isolated immediately after purification (labeled 2) or after 4 additional hours of culture in RPMI 1640 media (labeled 2+4) and assayed by qRT-PCR. The four genes were selected based on their inducibility at 9h after pulsed anti-IgM activation in vitro (Fig. S5E). The level of mRNA expression after 4h in vitro culture (hatched bars) was compared to freshly isolated cells from PBS-injected controls (white bars) or NP-BSA-injected animals (blue bars), with PCR assays being carried out in duplicates. Bars represent average ±SD within each group. * indicates p<0.05 by Mann-Whitney U test.
Fig. 7
Fig. 7. Mediators of pulsed activation-induced CD40 hyper-responsiveness
A) Down-regulation of Bank1 by pulsed-activation. Spleen B cells (left panel) or follicular B cells (middle panel) were activated by pulse (p) or continuous (c) anti-IgM stimulation. At various times after initiation of signaling, Bank1 mRNA expression was examined by qRT-PCR. The RNA data shown is the average ±SD of 3 independent RNA time-course experiments. Bank1 mRNA from antigen immunized mIgM-Tg mice was quantitated with RT-PCR (right panel). B cells purified from mIgM-Tg mice injected with PBS alone for 2h (labeled 2) or NP-BSA for 2h, and B cells from NP-BSA immunized animals that were cultured ex vivo for an additional 4h without stimulation (labeled 2+4). The data shown in the average ±SD of two PBS injected mice and three NP-BSA immunized mice. B) BANK protein expression was examined in B cells left untreated (−) or after pulse (p) or continuous (c) anti-IgM activation. Data shown is representative of 3 independent experiments (averaged in Fig. S6B). C) Up-regulation of c-Rel by pulsed activation. Pulse (p)- or continuous (c) anti-IgM treatment was initiated at 0h; 6 hours later anti-CD40 was added for an additional 1h. NE were prepared at the indicated times from anti-IgM-treated cells or after the additional hour of anti-CD40 treatment as indicated. RelA and c-Rel nuclear induction was analyzed by immunoblotting. Data shown is representative of 3 independent experiments (averaged in Fig. S6C). D) WCE were prepared 6h after pulse activation of spleen B cells with anti-IgM, as well as after further incubation for 18h in the presence or absence of anti-CD40 as indicated, and analyzed for pro- and anti-apoptotic protein expression. Data shown is representative of 2 independent experiments. E) Untreated or pulsed anti-IgM - activated B cells from WT (C57BL/6J) and c-Rel-deficient mice were activated with anti-CD40 6h after administration of pulse. 12h after anti-CD40 addition the proportion of enlarged cells was quantitated by flow cytometry (see Fig. S1B). The average ±SD of 4 experiments is shown. P value was calculated by Mann-Whitney U test.

Similar articles

Cited by

References

    1. Aiba Y, Yamazaki T, Okada T, Gotoh K, Sanjo H, Ogata M, Kurosaki T. BANK negatively regulates Akt activation and subsequent B cell responses. Immunity. 2006;24:259–268. - PubMed
    1. Blomen VA, Boonstra J. Cell fate determination during G1 phase progression. Cell Mol Life Sci. 2007;64:3084–3104. - PMC - PubMed
    1. Bystry RS, Aluvihare V, Welch KA, Kallikourdis M, Betz AG. B cells and professional APCs recruit regulatory T cells via CCL4. Nat Immunol. 2001;2:1126–1132. - PubMed
    1. Cheadle C, Vawter MP, Freed WJ, Becker KG. Analysis of microarray data using Z score transformation. J Mol Diagn. 2003;5:73–81. - PMC - PubMed
    1. de Alboran IM, O'Hagan RC, Gartner F, Malynn B, Davidson L, Rickert R, Rajewsky K, DePinho RA, Alt FW. Analysis of C-MYC function in normal cells via conditional gene-targeted mutation. Immunity. 2001;14:45–55. - PubMed

Publication types

MeSH terms

Associated data