. 2010 Apr 30;398(2):332-50.
doi: 10.1016/j.jmb.2010.03.001. Epub 2010 Mar 11.

Topological frustration in beta alpha-repeat proteins: sequence diversity modulates the conserved folding mechanisms of alpha/beta/alpha sandwich proteins

Affiliations

Topological frustration in beta alpha-repeat proteins: sequence diversity modulates the conserved folding mechanisms of alpha/beta/alpha sandwich proteins

Ronald D Hills Jr et al. J Mol Biol. .

Abstract

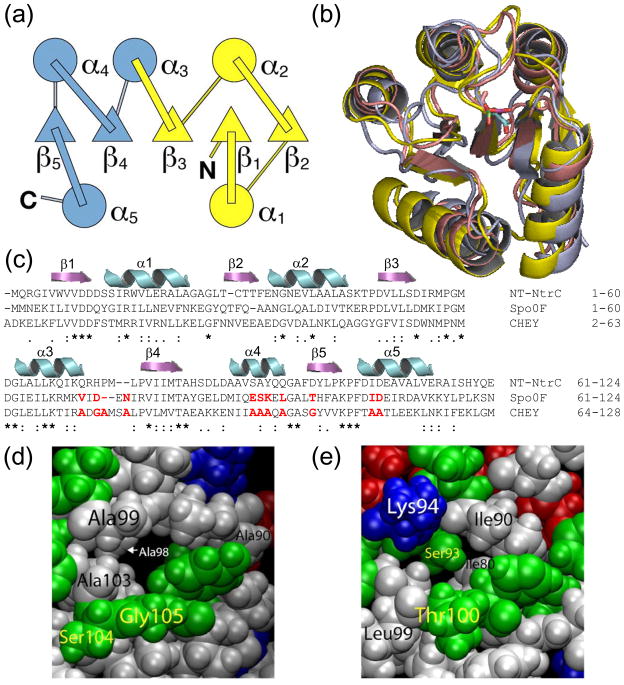
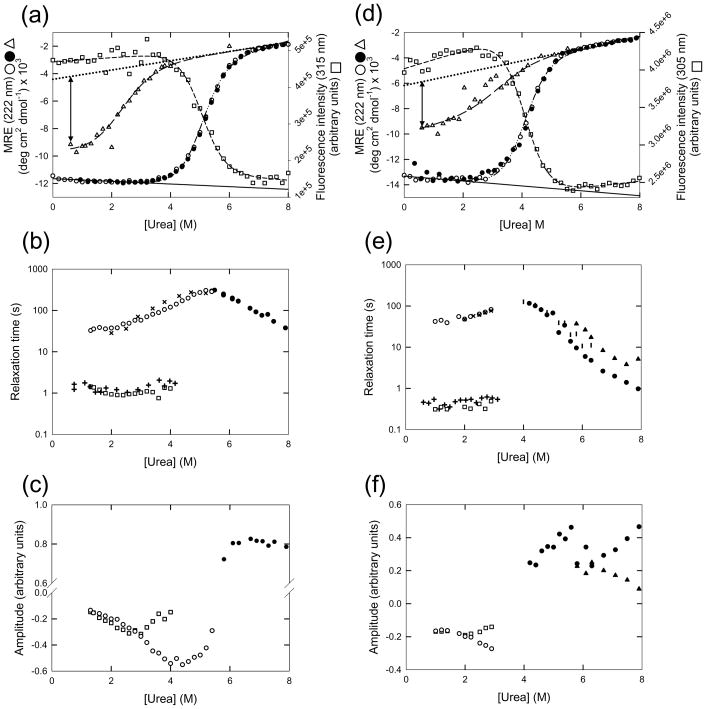
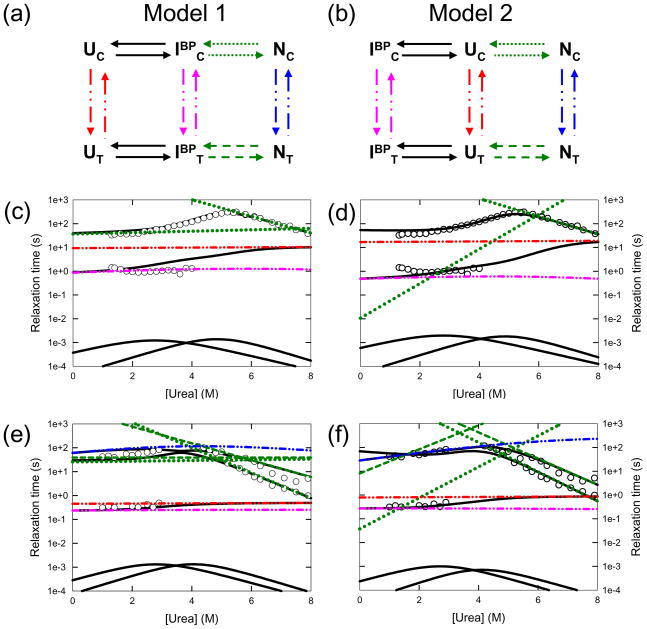
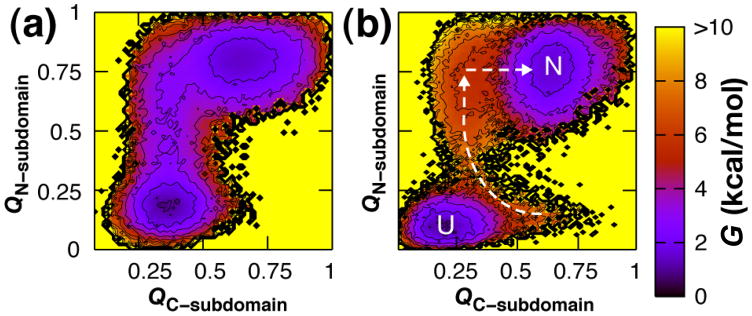
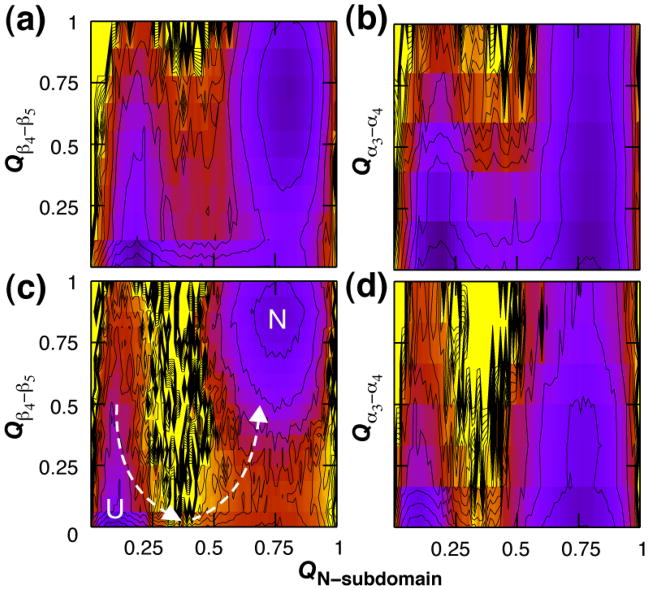
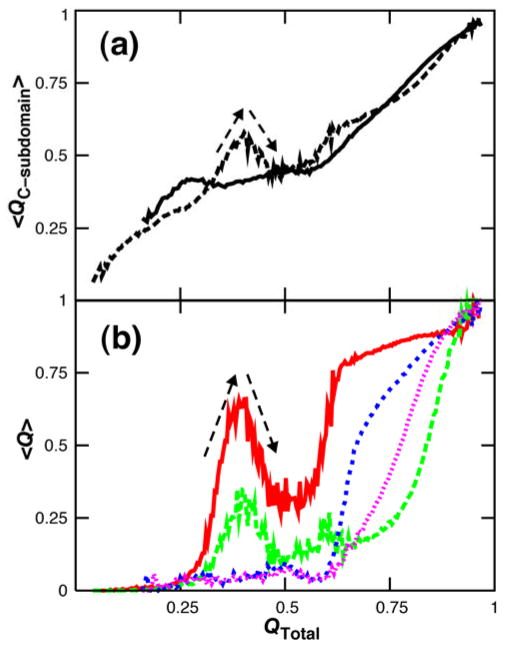
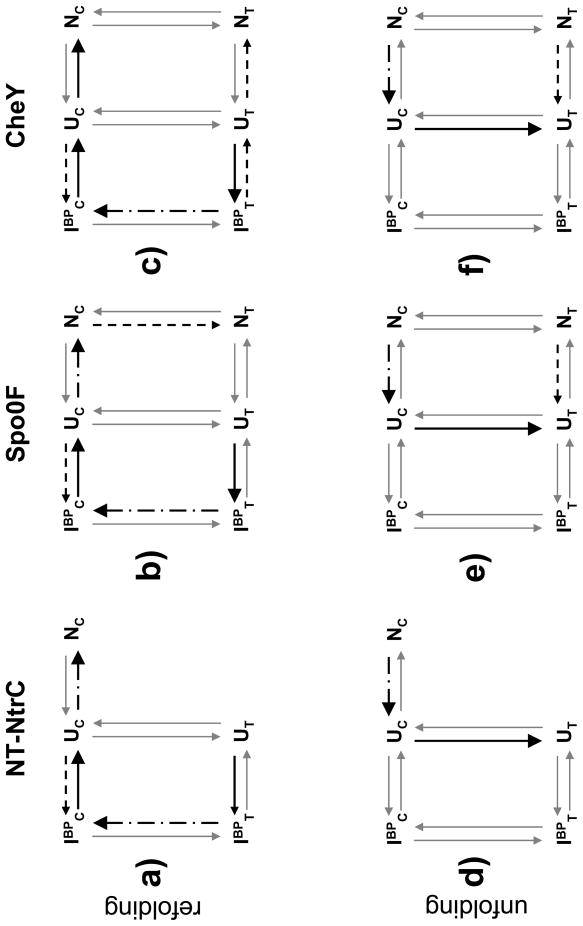
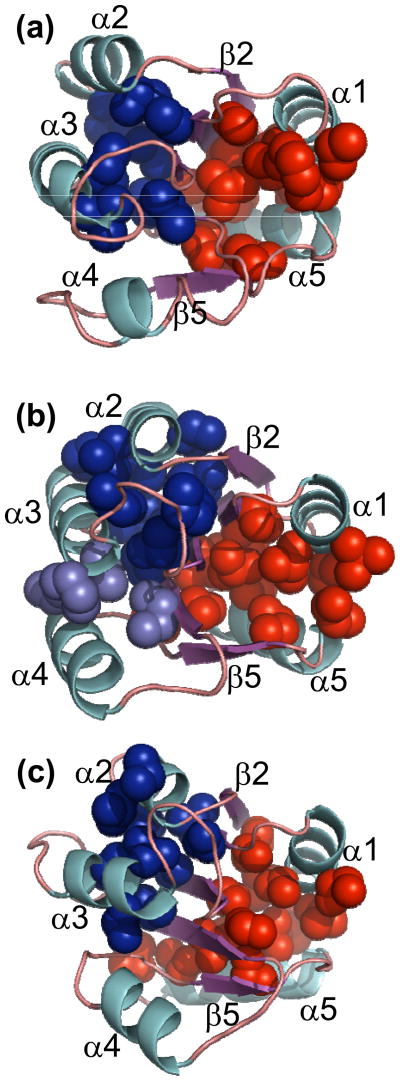
The thermodynamic hypothesis of Anfinsen postulates that structures and stabilities of globular proteins are determined by their amino acid sequences. Chain topology, however, is known to influence the folding reaction, in that motifs with a preponderance of local interactions typically fold more rapidly than those with a larger fraction of nonlocal interactions. Together, the topology and sequence can modulate the energy landscape and influence the rate at which the protein folds to the native conformation. To explore the relationship of sequence and topology in the folding of beta alpha-repeat proteins, which are dominated by local interactions, we performed a combined experimental and simulation analysis on two members of the flavodoxin-like, alpha/beta/alpha sandwich fold. Spo0F and the N-terminal receiver domain of NtrC (NT-NtrC) have similar topologies but low sequence identity, enabling a test of the effects of sequence on folding. Experimental results demonstrated that both response-regulator proteins fold via parallel channels through highly structured submillisecond intermediates before accessing their cis prolyl peptide bond-containing native conformations. Global analysis of the experimental results preferentially places these intermediates off the productive folding pathway. Sequence-sensitive Gō-model simulations conclude that frustration in the folding in Spo0F, corresponding to the appearance of the off-pathway intermediate, reflects competition for intra-subdomain van der Waals contacts between its N- and C-terminal subdomains. The extent of transient, premature structure appears to correlate with the number of isoleucine, leucine, and valine (ILV) side chains that form a large sequence-local cluster involving the central beta-sheet and helices alpha2, alpha 3, and alpha 4. The failure to detect the off-pathway species in the simulations of NT-NtrC may reflect the reduced number of ILV side chains in its corresponding hydrophobic cluster. The location of the hydrophobic clusters in the structure may also be related to the differing functional properties of these response regulators. Comparison with the results of previous experimental and simulation analyses on the homologous CheY argues that prematurely folded unproductive intermediates are a common property of the beta alpha-repeat motif.


Figures

Figure 1
Figure 1
(a) Topology of CheY-like proteins. The central β-sheet comprises 5 parallel β strands in the order β2β1β3β4β5 and forms an α/β/α sandwich with helices α1 and α5 on one face of the sheet and helices α2, α3 and α4 on the other. The N-terminal (yellow) and C-terminal (blue) folding subdomains of CheY are comprised of β1α1β2α2β3 and α3β4α4β5α5, respectively. (b) Structural alignment of NT-NtrC (blue), Spo0F (red) and CheY (yellow). The pair-wise RMSD values for CheY:NT-NtrC, CheY:Spo0F and NT-NtrC:Spo0F are 2.57 Å, 1.85 Å and 2.44 Å respectively. The catalytic aspartic acid residue, 54 in NT-NtrC, 54 in Spo0F and 57 in CheY, is at the beginning of the loop connecting the two subdomains and is shown as sticks. The PDB codes used were NT-NtrC: 1DC7, Spo0F: 1SRR and CheY: 3CHY. (c) Sequence alignment of NT-NtrC, Spo0F and CheY using ClustalW. The pair-wise sequence alignment scores for CheY:NT-NtrC, CheY:Spo0F and NT-NtrC:Spo0F are 30%, 25% and 33%, respectively. The elements of secondary structure are indicated above the aligned sequences, and the sequence conservation is indicated below, (*) identical, (:) conserved and (.) semi-conserved. Residues highlighted in red font denote either C-terminal alanines and glycines in CheY or corresponding residues in Spo0F with bulkier side-chains. (d) An alanine-rich cavity resides between α4 and β4β5 in the inactive CheY structure. (e) The same region in Spo0F is filled with bulkier residues.
Figure 2
Figure 2
Equilibrium and kinetic experimental analyses of NT-NtrC and Spo0F. (a) Equilibrium unfolding and refolding of NT-NtrC. The equilibrium denaturation is completely reversible as is seen by the coincidence of the unfolding (○) and refolding (●) CD signal at 222 nm plotted as a function of denaturant concentration. The fit to a two-state model is shown (broken and dotted line). The baselines for the native state (continuous line) and the unfolded state (dotted line) predicted from the two-state model are also shown. The burst-phase amplitude measured by stopped-flow CD refolding of NT-NtrC from 6 M urea is plotted as a function of final urea concentration (△) and fit to a two-state model (thick broken line). The magnitude of the burst-phase amplitude under strongly refolding conditions (0.6 M urea) is represented by the double-headed arrow. The FL intensity at 315 nm is plotted as a function of urea concentration (□) and fit to a two-state model (thin dashed line). (b) Chevron analysis of NT-NtrC. The recovery of the native signal upon refolding from high denaturant concentration occurs by bi-exponential kinetics. The relaxation times determined by CD [(×), slow phase; (+), fast phase] and by FL [(○), slow phase; (□), fast phase] are shown. The amplitudes associated with the fast refolding phase by both CD and FL at denaturant concentrations > 4 M urea and the amplitudes associated with the slow refolding phase by CD at denaturant concentrations < 2 M urea were too small to obtain accurate relaxation times and were thus excluded from the chevron analysis. A single phase is observed in unfolding kinetics; the relaxation times determined by FL (●) are also shown. (c) Amplitudes associated with the relaxation times determined by FL. The symbols used are the same as in (b). (d) Equilibrium unfolding and refolding of Spo0F. The symbols used are the same as in (a). The reversibility of the equilibrium denaturation is seen by the coincidence of the unfolding (○) and refolding (●) CD signal at 222 nm plotted as a function of denaturant concentration. The burst-phase amplitude (△) is measured by stopped-flow CD refolding of Spo0F from 6 M urea. The FL intensity (□) at 305 nm is plotted as a function of urea concentration. (e) Chevron analysis of Spo0F. The refolding relaxation times determined by CD [(×), slow phase; (+), fast phase] and by FL [(○), slow phase; (□), fast phase], and the unfolding relaxation times determined by CD (|) and by FL [(●), fast phase; (▲), slow phase] are shown. (f) Amplitudes associated with the relaxation times determined by FL. The symbols used are the same as in (e). Buffer conditions: 10 mM potassium phosphate at pH 7.0 and 25 °C.
Figure 3
Figure 3
Global analysis of NT-NtrC and Spo0F (a) Model 1: The on-pathway model. The folding mechanism occurs via parallel channels based on the isomerization state of the K104–P105 peptide bond. The burst-phase species, IBP is placed on-pathway, between the unfolded and native states along either channel. (b) Model 2: The off-pathway model. The burst-phase species, IBP is placed off-pathway from the unfolded states in both channels. (c) Predicted chevron for NT-NtrC from the on-pathway model. The predicted observable relaxation times are shown as continuous black lines; the microscopic rate constants determined by the model are shown as dotted green lines for the cis channel. The isomerization relaxation times in each state are shown as broken and dotted lines, blue for the native states, red for the unfolded states, and magenta for the burst-phase intermediates. The chevron analysis from Fig. 2b is shown as open circles for comparison. (d) Predicted chevron for NT-NtrC from the off-pathway model. The legends are the same as in (c). (e) Predicted chevron for Spo0F from the on-pathway model. The legends are the same as in (c) and the microscopic rate constants for the trans channel are shown as broken green lines. The chevron analyses from Fig. 2e are shown as open circles for comparison. (f) Predicted chevron for Spo0F from the off-pathway model. The legends are the same as in (e).
Figure 4
Figure 4
Gō-model results for the thermodynamic characterization of the N-terminally nucleated folding landscapes for (a) NT-NtrC (b) and Spo0F. The free energy, G, is shown as a function of the fraction of native contacts formed within the N-subdomain (QN-subdomain) and the fraction of native contacts formed within the C-subdomain (QC-subdomain). Off-pathway frustration is evident for Spo0F for which the prematurely structured C-subdomain must unfold in order for the N-subdomain to fold and drive the progression to the native state. Contours are drawn every kcal mol−1; values exceeding 10 kcal mol−1 and regions not sampled are shown in yellow. The free energy is computed at the folding transition temperature such that the folded and unfolded states are equally populated.
Figure 5
Figure 5
Frustration in the C-subdomain of NT-NtrC and Spo0F. The free energy is shown as a function of the fraction of native contacts formed within the N-subdomain and between β4 and β5 (a, c), and within the N-subdomain and between α3 and α4 (b, d). Premature structure in the C-subdomain of NT-NtrC (a, b) does not preclude N-subdomain folding. For Spo0F (c, d), N-subdomain folding is seen to accompany an initial unfolding of C-subdomain contacts, as evidenced by the high energy barrier bisecting the path to N at QN-subdomain = 0.4. The energy scale is described in the caption to Figure 5.
Figure 6
Figure 6
Influence of frustration on kinetics. The fraction of native contacts formed at each time point was computed for 100 independent kinetic folding simulations and ensemble-averaged. (a) The mean fraction of C-subdomain contacts formed is shown as a function of the fraction of native contacts formed in the entire protein for NT-NtrC, solid line, and Spo0F, broken line. (b) The mean fraction of contacts formed in different regions of a protein is shown as a function of the fraction of native contacts formed in the entire protein. For Spo0F, contacts between β4 and β5 are in red and those between α3 and α4 in green. The corresponding regions for NT-NtrC are in blue and pink respectively. The large negative slopes at QTotal = 0.4 indicate local unfolding, or backtracking, of C-subdomain contacts in Spo0F.
Figure 7
Figure 7
Mechanism for (a–c) refolding of NT-NtrC, Spo0F and CheY, respectively, under strongly refolding conditions and (d–f) unfolding under strongly unfolding conditions predicted by the off-pathway model. The progress of the reaction is shown as thick arrows, while the reactions not accessible under the respective conditions are represented by thin gray arrows. The rate-limiting reactions are shown as broken and dotted lines, and the minor channels are shown as broken lines. (a) Refolding of NT-NtrC. The dominant unfolded state with the K104-P105 bond in the trans isomer, UT, collapses within the burst-phase of stopped-flow instrumentation (~ 5 ms) to an off-pathway intermediate, IBPT. Isomerization of the prolyl bond gives rise to the fast refolding phase followed by the slow phase corresponding to at least partial unfolding of the intermediate to access the productive TSE between UC and NC. A small contribution to the burst-phase reaction from the minor unfolded population, UC is also shown. (b) Refolding of Spo0F. The progression of events is identical to that of NT-NtrC, with the exception that the native state slowly isomerizes to an alternate native state, NT, which is populated to ~ 5% at equilibrium. (c) Refolding of CheY. The isomerization reaction of the IBPT intermediate in CheY is significantly slower than that observed in the other two proteins. This reaction gives rise to the only observable refolding phase that masks all subsequent reactions. A small fraction of the intermediate can also fold to the NT state, which is populated to ~ 15% at equilibrium. (d) Unfolding of NT-NtrC. Under strongly unfolding conditions, the native state unfolds globally by a single unfolding phase. The acquisition of the equilibrium population of the UT state is optically silent. (e) Unfolding of Spo0F is similar to that of NT-NtrC. An additional small amplitude unfolding phase is explained by the independent unfolding of a small population of the NT state, similar to that observed during the unfolding of CheY (f).
Figure 8
Figure 8
Clusters of branched aliphatic side-chain residues in (a) NT-NtrC (1DC7.pdb11), (b) Spo0F (1SRR.pdb12) and (c) CheY (3CHY.pdb10). Cartoon representation of the NMR solution structure of NT-NtrC and the crystal structures of Spo0F and CheY are shown. α-helices are colored cyan, β-strands are magenta and loops are in light orange. ILV residues that bury greater than 10 Å2 by contacting other ILV residues are highlighted, and the VDW surfaces of the heavy atoms of these residues are shown as spheres. Two major clusters of ILV residues are observed in all three proteins, one on either side of the central β-sheet. The cluster on the side facing helices α2, α3 and α4 is designated Cluster 1 and is colored blue, while the cluster on the side facing helices α1 and α5 is designated Cluster 2 and is colored red. An additional group of four ILV residues (light blue) that appears contiguous with Cluster 1 is observed in Spo0F and is considered to be a part of Cluster 1. Cluster 1 in all three proteins comprises residues that are closer in sequence that those in Cluster 2.

Similar articles

Cited by

References

    1. Anfinsen CB, Scheraga HA. Experimental and theoretical aspects of protein folding. Adv Protein Chem. 1975;29:205–300. - PubMed
    1. Onuchic JN, Wolynes PG. Theory of protein folding. Curr Opin Struct Biol. 2004;14:70–75. - PubMed
    1. Plaxco KW, Simons KT, Baker D. Contact order, transition state placement and the refolding rates of single domain proteins. J Mol Biol. 1998;277:985–994. - PubMed
    1. Ivankov DN, Garbuzynskiy SO, Alm E, Plaxco KW, Baker D, Finkelstein AV. Contact order revisited: Influence of protein size on the folding rate. Protein Sci. 2003;12:2057–2062. - PMC - PubMed
    1. Kamagata K, Kuwajima K. Surprisingly high correlation between early and late stages in non-two-state protein folding. J Mol Biol. 2006;357:1647–1654. - PubMed

Publication types

LinkOut - more resources