. 2010 Mar 12;37(5):620-32.
doi: 10.1016/j.molcel.2010.02.018.

MicroRNA-451 regulates LKB1/AMPK signaling and allows adaptation to metabolic stress in glioma cells

Affiliations

MicroRNA-451 regulates LKB1/AMPK signaling and allows adaptation to metabolic stress in glioma cells

Jakub Godlewski et al. Mol Cell. .

Abstract

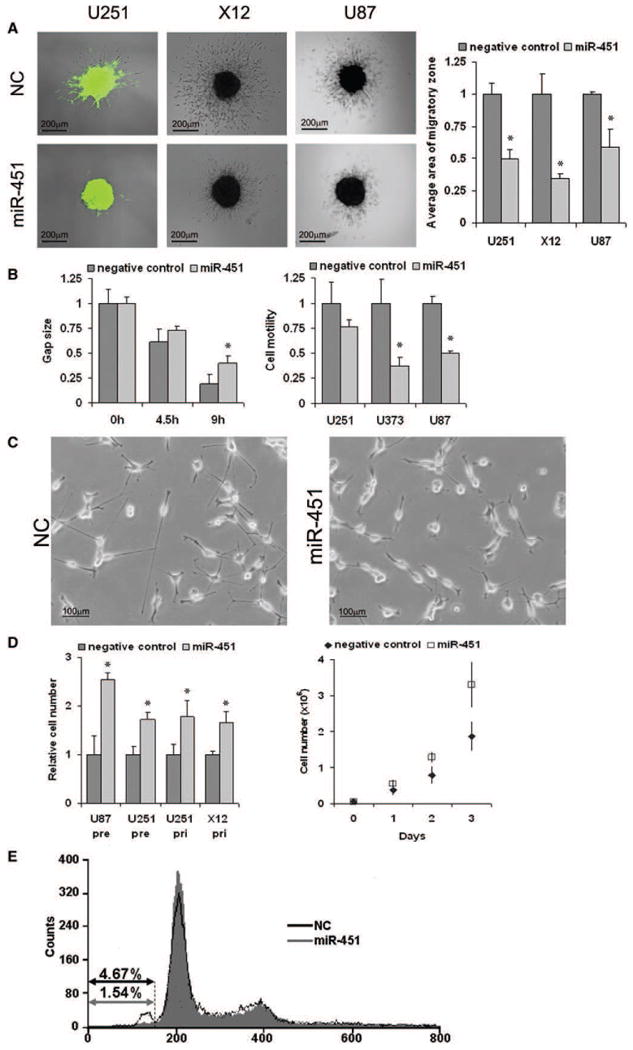
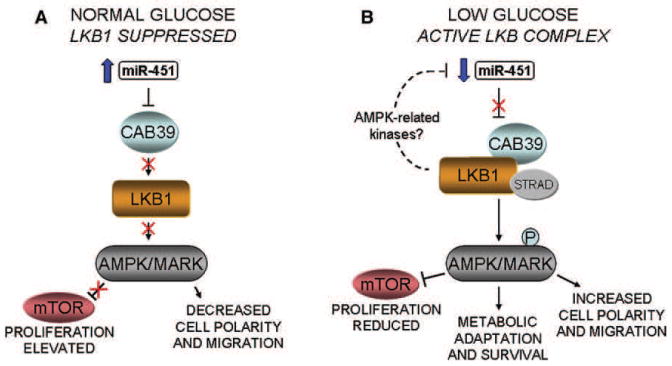
To sustain tumor growth, cancer cells must be able to adapt to fluctuations in energy availability. We have identified a single microRNA that controls glioma cell proliferation, migration, and responsiveness to glucose deprivation. Abundant glucose allows relatively high miR-451 expression, promoting cell growth. In low glucose, miR-451 levels decrease, slowing proliferation but enhancing migration and survival. This allows cells to survive metabolic stress and seek out favorable growth conditions. In glioblastoma patients, elevated miR-451 is associated with shorter survival. The effects of miR-451 are mediated by LKB1, which it represses through targeting its binding partner, CAB39 (MO25 alpha). Overexpression of miR-451 sensitized cells to glucose deprivation, suggesting that its downregulation is necessary for robust activation of LKB1 in response to metabolic stress. Thus, miR-451 is a regulator of the LKB1/AMPK pathway, and this may represent a fundamental mechanism that contributes to cellular adaptation in response to altered energy availability.


Figures

Figure 1
Figure 1. miR-451 Is Downregulated in Glioma Cell Migration
(A) Representative images of RFP-labeled glioma cells in the spheroid assay at day 0 and day 3 are shown. RNA was extracted from multiple spheroid assays for subsequent profiling. (B) Scatter plot showing miR profiling data for U87 cells at day 0 and day 3 of the spheroid migration assay. The largest alterations are marked in red (upregulated) and green (downregulated). miR precursors are marked with asterisks. miR-451 is labeled in bold. (C) Downregulation of miR-451 was validated by qRT-PCR in three independent glioma cell lines at day 0 and day 3 of migration in the spheroid assay. X12 cells were incubated with 20 mM LiCl to block migration. Values are expressed as mean relative miR-451 expression level ± SD. *p < 0.01.
Figure 2
Figure 2. miR-451 Controls Migration and Proliferation in Glioma Cell Lines
(A) Effect of miR-451 expression on glioma spheroid migration. (Left) Representative images of spheroid migration of control U251 and X12 glioma cells (NC) or transduced with pri-miR-451 vector and U87 cells transfected with negative control miR (NC) or miR-451 precursors. Migratory zones were quantified after 48 hr of migration (right), expressed as mean area of migration ± SD. *p < 0.01. (B) Effects of miR-451 in additional motility assays. Control U251 glioma cells (NC) or cells transduced with miR-451 vector were subjected to a wound-healing/ scratch assay. Gap size was measured after the time indicated and is shown as a fraction of control (mean relative migration ± SD) (left). Three glioma cell lines were transfected with either negative control miR or miR-451 precursors. U251 and U373 cell lines were used for transwell assays with Matrigel-coated inserts, and U87 cells were used in a noncoated assay (right). Data are expressed as mean migration relative to controls ± SD. (C) miR-451 expression causes changes in cell morphology. Representative images of X12 glioma cells stably expressing empty vector (NC) and miR-451 are shown. (D) Effect of miR-451 expression on proliferation. Cell number was quantified after 72 hr of growth (left). Cells were either transiently transfected with negative control miR and miR-451 precursors (pre) or stably transfected with empty vector or miR-451 vector (pri). (Right) A growth curve of U251 cells stably expressing miR-451 compared with controls. Data are expressed as mean ± SD. (E) Effect of miR-451 expression on apoptosis. Flow cytometry was performed on propidium iodide-stained U251 cells stably expressing miR-451 compared with empty vector controls (NC). The percentage of cells in the sub-G0 fraction is shown.
Figure 3
Figure 3. Identification and Characterization of CAB39 as a Target of miR-451
(A) CAB39 mRNA levels increase during the course of a spheroid migration assay. Cells were harvested at day 0 and day 3 of migration and analyzed for CAB39 mRNA levels by qRT-PCR. Relative CAB39 mRNA expression is shown as mean ± SD. (B) Effect of miR-451 on CAB39 mRNA levels. Cells were either transiently transfected with negative control miR and miR-451 precursors (pre) or stably transfected with empty vector or miR-451-expressing vector (pri). CAB39 mRNA levels were measured by qRT-PCR and expressed as mean ± SD. (C) Effect of miR-451 alterations on CAB39 protein levels. Glioma cell lines were either transiently transfected with negative control miR (NC) and miR-451 precursors (pre) or stably transfected with empty vector (NC) or miR-451-expressing vector (pri) (left). U251 cells were transiently transfected with negative control miR (NC), miR-451 precursor as a positive control (451), or anti-miR-451 (a451) (right). Cell lysates were blotted with anti-CAB39 antibody, and anti-α-tubulin antibody was used as a loading control. (D) Direct targeting of CAB39 3′UTR by miR-451. COS7 cells were cotransfected with luciferase/CAB39 3′UTR reporter vector (WT) and either 40 nM or 60 nM negative control miR or miR-451. A reporter vector with a mutated miR-451-binding site in the CAB39 3′UTR (mut) was used as a control. Luciferase levels are expressed as mean relative to controls ± SD; *p < 0.01. Wild-type and mutated miR-451 target sites within the CAB39 3′-UTR are shown below. (E) Effect of CAB39 downregulation on glioma cell proiferation. LN229 glioma cells were transfected with siRNA against CAB39 or negative control siRNA, and cell number was quantified after 48 hr of growth and expressed as mean relative growth ± SD. Corresponding cell lysates blotted with anti-CAB39 antibody and anti-α-tubulin antibody as a loading control are shown below. (F) Effect of CAB39 downregulation on glioma cell migration. CAB39 siRNA-transfected glioma cells were analyzed in the spheroid migration assay. Representative images of spheroid migration of LN229 and U87 glioma cells transfected with negative control siRNA (NC) or CAB39 siRNA are shown (left). Migratory zones were quantified after 48 hr and are shown as mean ± SD (right).
Figure 4
Figure 4. miR-451 Expression in Patient Tumors and Localization by In Situ Hybridization
(A) miR-451 levels were measured in paired GBM and nonpathologic adjacent normal tissue by qRT-PCR. Each patient sample pair is marked with a different color, and overall values are expressed as mean ± SD. (B) Representative ISH staining for miR-451 expression in GBM samples (top) and normal brain (bottom) is shown. The signal is blue, and counterstain is pink. (C) Expression of miR-451 in areas around blood vessels in tumors. Representative ISH staining is shown. Blood vessel is labeled BV. (D) Localization of miR-451, CAB39, and proliferative marker Ki67 in brain tumor samples. Representative hematoxylin staining (upper- and lower-left panels), ISH staining for miR-451 (upper- and lower-right panels, blue), and immunostaining for CAB39 (upper-right panel, red) and Ki67 (lower-right panel, red) are shown. Overall staining (left) was converted to fluorescence signal (right) using the Nuance system. Colocalization is visualized in green. Quantification of positive cell numbers in multiple fields for miR-451/CAB39 (top graph) and miR-451/Ki67 (bottom graph) is shown as mean ± SD. (E) Association of miR-451 expression with patient survival (Kaplan-Meier plot) in GBM. Data were obtained from The Cancer Genome Atlas. p = 0.036. See also Figure S1.
Figure 5
Figure 5. miR-451 Affects Pathways Involved in Proliferation and Migration via LKB1 Signaling
(A) Effect of miR-451 expression and CAB39 downregulation on LKB1/STRAD/CAB39 complex stability. LKB1 was immunoprecipitated (IP) from U251 cells transfected with negative control oligonucleotides (NC), miR-451 precursor, or siRNA CAB39 and was blotted with anti-CAB39 and anti-STRAD antibodies. Input controls were blotted with anti-CAB39, anti-STRAD, and anti-LKB1 antibodies, and anti-α-tubulin antibody was used as a loading control. (B) Effect of miR-451 expression on LKB1 activity in a linked peptide phosphorylation assay. Data are shown as mean phosphate incorporation ± SD. U251 cells were transfected with negative control miR (NC) and miR-451 precursor and were subjected to LKB1 IP followed by a kinase assay. Input controls were blotted with anti-CAB39 antibody, and anti-α-tubulin antibody was used as a loading control. (C) Effect of miR-451 expression on AMPK phosphorylation and downstream pathways, including mTOR. Western blotting was carried out on U251 glioma cells transfected with negative control miR (NC) or miR-451 precursors. Anti-CAB-39, anti-phospho-AMPK, anti-AMPK, anti-phospho-Raptor, anti-Raptor, anti-phos-pho-ACC, anti-ACC, anti-phospho-TSC2, anti-TSC2, anti-phospho-p70S6K, anti-p70S6K, anti-phospho-ribosomal protein S6, and anti-ribosomal protein S6 antibodies were blotted, and anti-α-tubulin antibody was used as a loading control. (D) Effect of miR-451 expression and CAB39 downregulation on mTOR signaling. U251 glioma cells and HeLa cells deficient in LKB1 were used. Western blotting was performed after transfection with negative control miR or negative control siRNA (NC), miR-451, and siRNA CAB39. Anti-CAB39, anti-phospho-AMPK, anti-AMPK, and anti-phospho-ribosomal protein S6 antibodies were blotted, and anti-α-tubulin antibody was used as a loading control. (E) Effect of miR-451 expression on LKB1 downstream target protein MARK3 phosphorylation. MARK3 was immunoprecipitated (IP) from U251 cells transfected with negative control miR (NC) or miR-451 precursor and blotted with anti-phospho-MARKs antibody. Input controls were blotted with anti-CAB39 and anti-MARK3 antibodies, and anti-α-tubulin antibody was used as a loading control. (F) Effect of glucose deprivation on glioma cell migration. U87 spheroid migration was observed in several glucose concentrations. Representative images of spheroid migration in 2.25 g/l glucose versus 0.3 g/l glucose after 6 hr are shown (left). Migratory zones were quantified and expressed as mean area of migration ± SD. *p < 0.01 (right). See also Figure S2.
Figure 6
Figure 6. Glucose and LKB1 Regulate miR-451 Levels, and miR-451 Reduction Is Critical for the Cellular Response to Glucose Withdrawal
(A) Effect of glucose deprivation on miR-451 expression levels. Cells were cultured for 24 hr in normal (+, glucose 4.5 g/l) or reduced glucose (−, glucose 0.3 g/l) medium. miR-451 levels were then measured by qRT-PCR and expressed as mean relative to normal medium controls ± SD. (B) Effect of AMPK and LKB1 downregulation on miR-451 expression. U87, U251,and U373 glioma cells were transfected with negative control siRNA, AMPKα1 siRNA, or LKB1 siRNA. miR-451 levels were measured 48 hr after transfection by qRT-PCR and expressed as mean relative to controls ± SD (left). Corresponding western blots with anti-AMPK, anti-LKB1, and anti-α-tubulin antibody as a loading control are shown below (right). (C) Effect of miR-451 expression on glucose deprivation-dependent AMPK activation. U251 cells were transfected either with negative control miR (NC) or miR-451 precursor and grown in normal (+, glucose 4.5 g/l) or reduced glucose (−, glucose 0.3 g/l) medium for 18 hr. Cell lysates were blotted with anti-CAB39, anti-phospho-AMPK, anti-AMPK, anti-phospho-Raptor, and anti-Raptor antibodies. Anti-α-tubulin antibody was used as a loading control. (D) Effect of miR-451 expression on cellular response to glucose deprivation. U251 cells were transfected either with negative control miR (NC) or miR-451 precursor and were grown in normal (+, glucose 4.5 g/l) or reduced glucose (−, glucose 0.3 g/l) medium for 24 hr. Cell number was quantified by crystal violet staining and was expressed as mean cell number relative to controls ± SD. *p < 0.01. See also Figure S3.
Figure 7
Figure 7. Proposed Role of miR-451 in the Regulation of LKB1 Signaling in Response to Glucose
(A) Under normal glucose conditions, higher levels of miR-451 suppress the expression of CAB39 through directly targeting its 3′UTR. This leads to repression of LKB1 activity and, consequently, reduced activity of substrates, including AMPK and MARKs. The reduced levels of AMPK allow unrestrained mTOR activation, promoting cell proliferation. (B) Under conditions of reduced glucose, declining miR-451 levels result in increased expression of CAB39 and stabilization of the active LKB1 signaling complex. This results in the phosphorylation and activation of LKB1 substrates, including AMPK and MARKs, leading to: (1) reduced cell proliferation through reduced mTOR activity; (2) initiation of responses to metabolic stress, leading to adaptation and cell survival; (3) increased cell polarity and activation of migration pathways through phosphorylation of MARKs and effects on the cytoskeleton. The dashed line illustrates a potential feedback loop between LKB1 and miR-451, which may be mediated via additional AMPK-related kinase substrates of LKB1 and which allow a sustained and robust response to glucose deprivation.

References

    1. Asada N, Sanada K, Fukada Y. LKB1 regulates neuronal migration and neuronal differentiation in the developing neocortex through centrosomal positioning. J Neurosci. 2007;27:11769–11775. - PMC - PubMed
    1. Baas AF, Kuipers J, van der Wel NN, Batlle E, Koerten HK, Peters PJ, Clevers HC. Complete polarization of single intestinal epithelial cells upon activation of LKB1 by STRAD. Cell. 2004;116:457–466. - PubMed
    1. Bandres E, Bitarte N, Arias F, Agorreta J, Fortes P, Agirre X, Zarate R, Diaz-Gonzalez JA, Ramirez N, Sola JJ, et al. microRNA-451 regulates macrophage migration inhibitory factor production and proliferation of gastrointestinal cancer cells. Clin Cancer Res. 2009;15:2281–2290. - PubMed
    1. Bartel DP. MicroRNAs: target recognition and regulatory functions. Cell. 2009;136:215–233. - PMC - PubMed
    1. Beadle C, Assanah MC, Monzo P, Vallee R, Rosenfeld SS, Canoll P. The role of myosin II in glioma invasion of the brain. Mol Biol Cell. 2008;19:3357–3368. - PMC - PubMed

Publication types

MeSH terms