. 2010 May;263(1-2):43-51.
doi: 10.1016/j.heares.2010.03.003. Epub 2010 Mar 19.

Posture systematically alters ear-canal reflectance and DPOAE properties

Affiliations

Posture systematically alters ear-canal reflectance and DPOAE properties

Susan E Voss et al. Hear Res. 2010 May.

Abstract

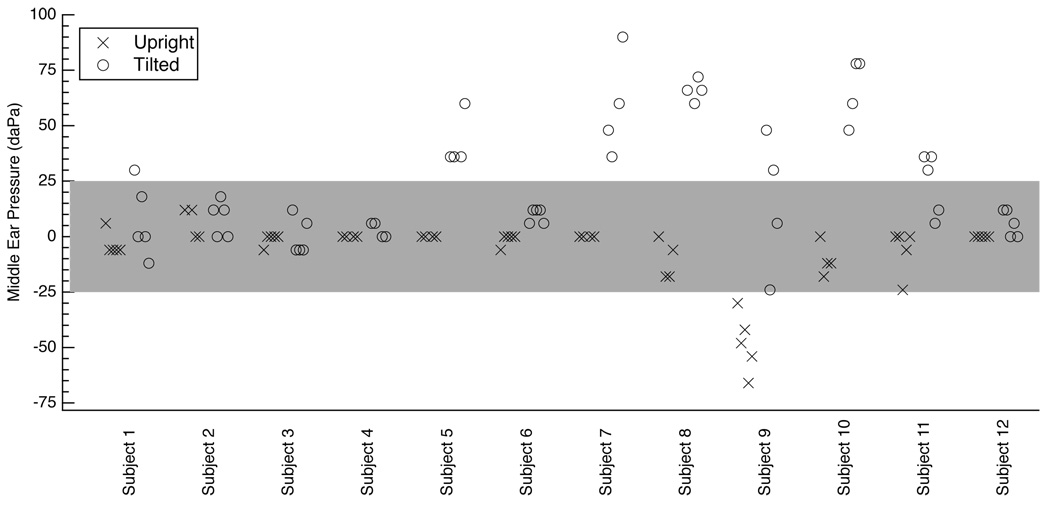
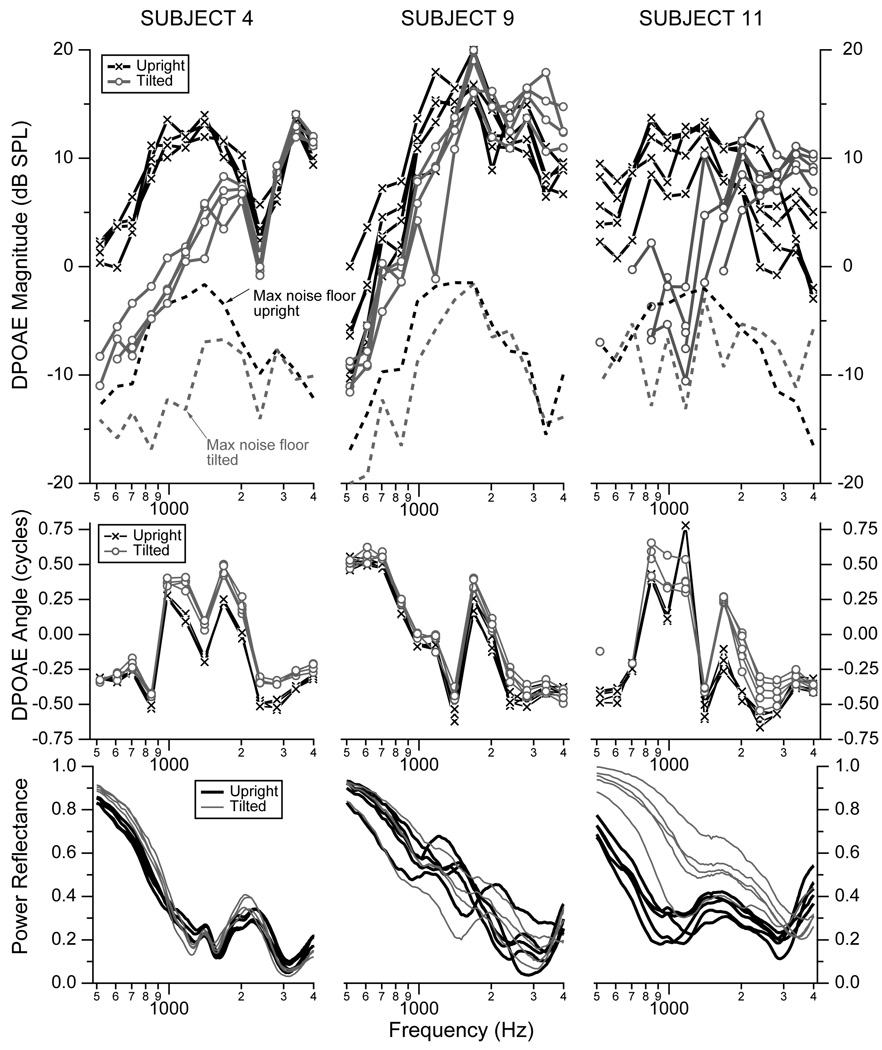
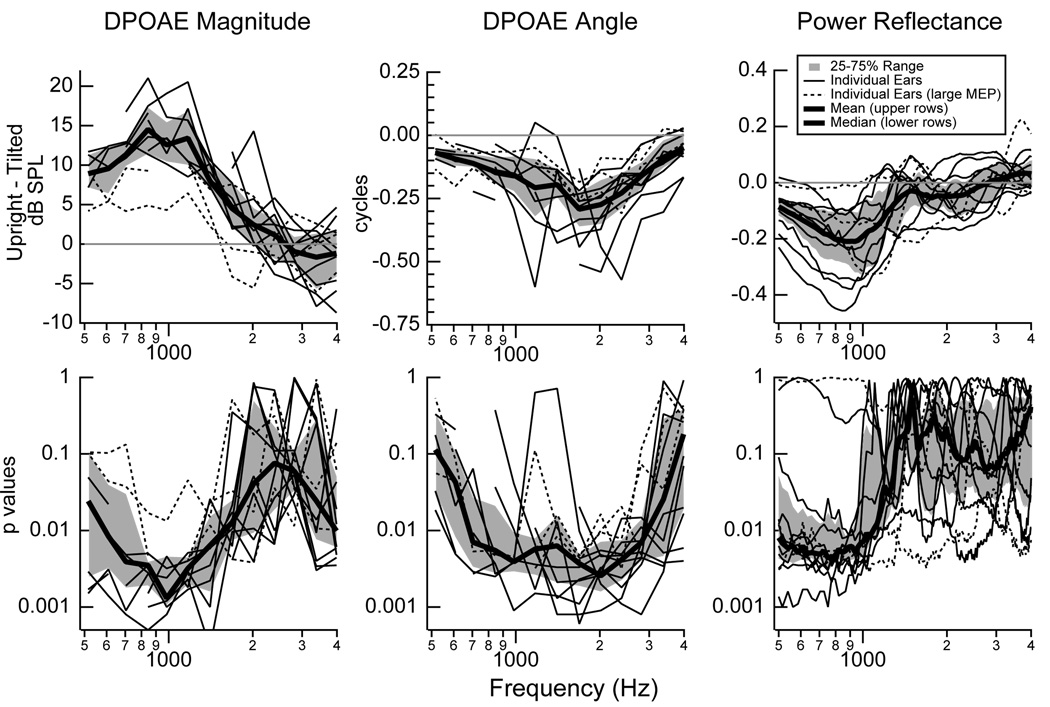
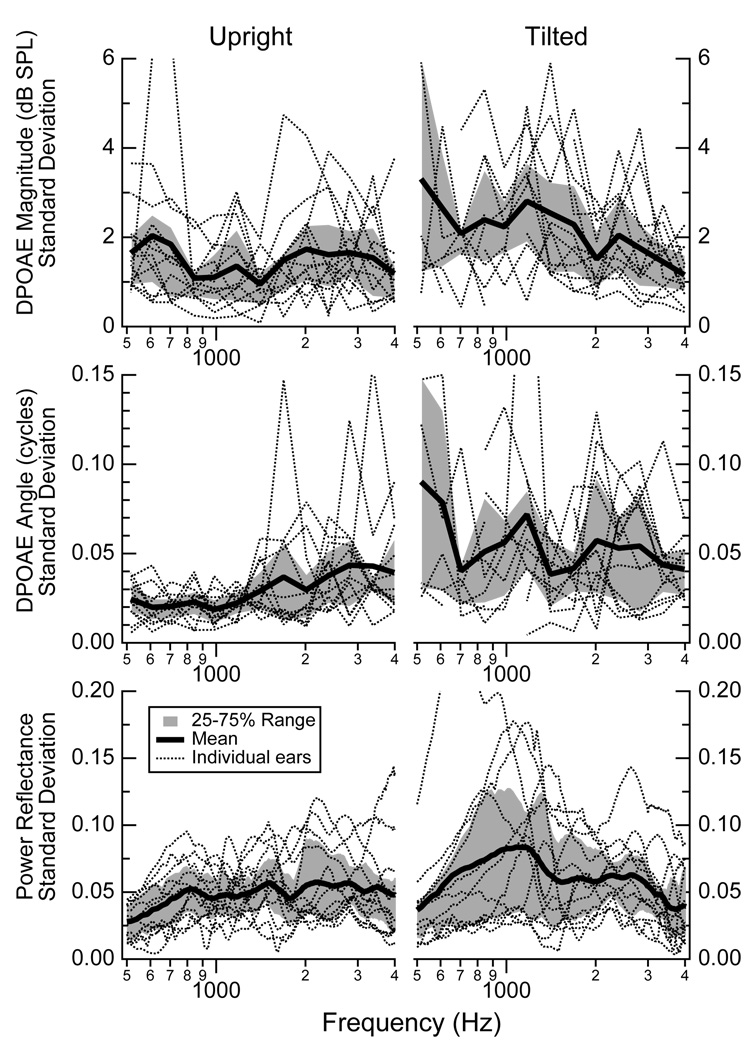
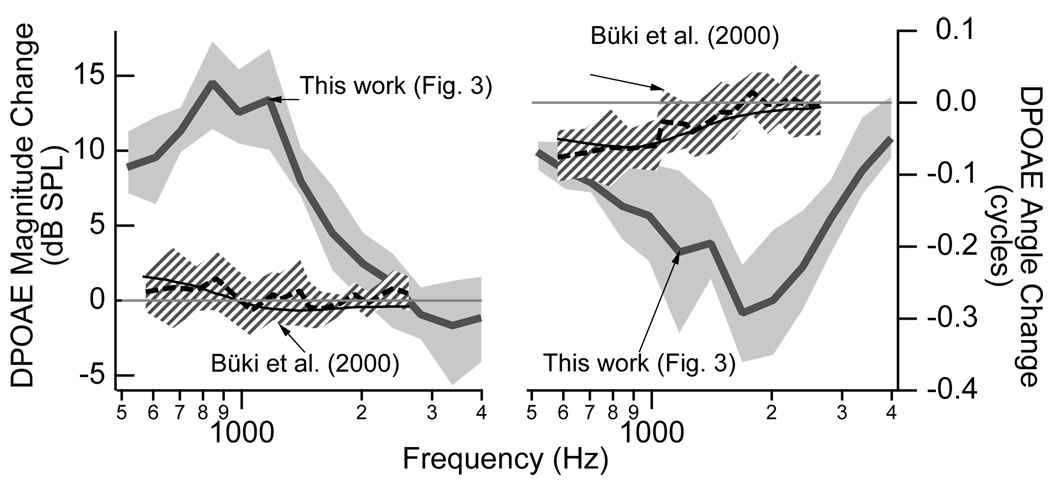
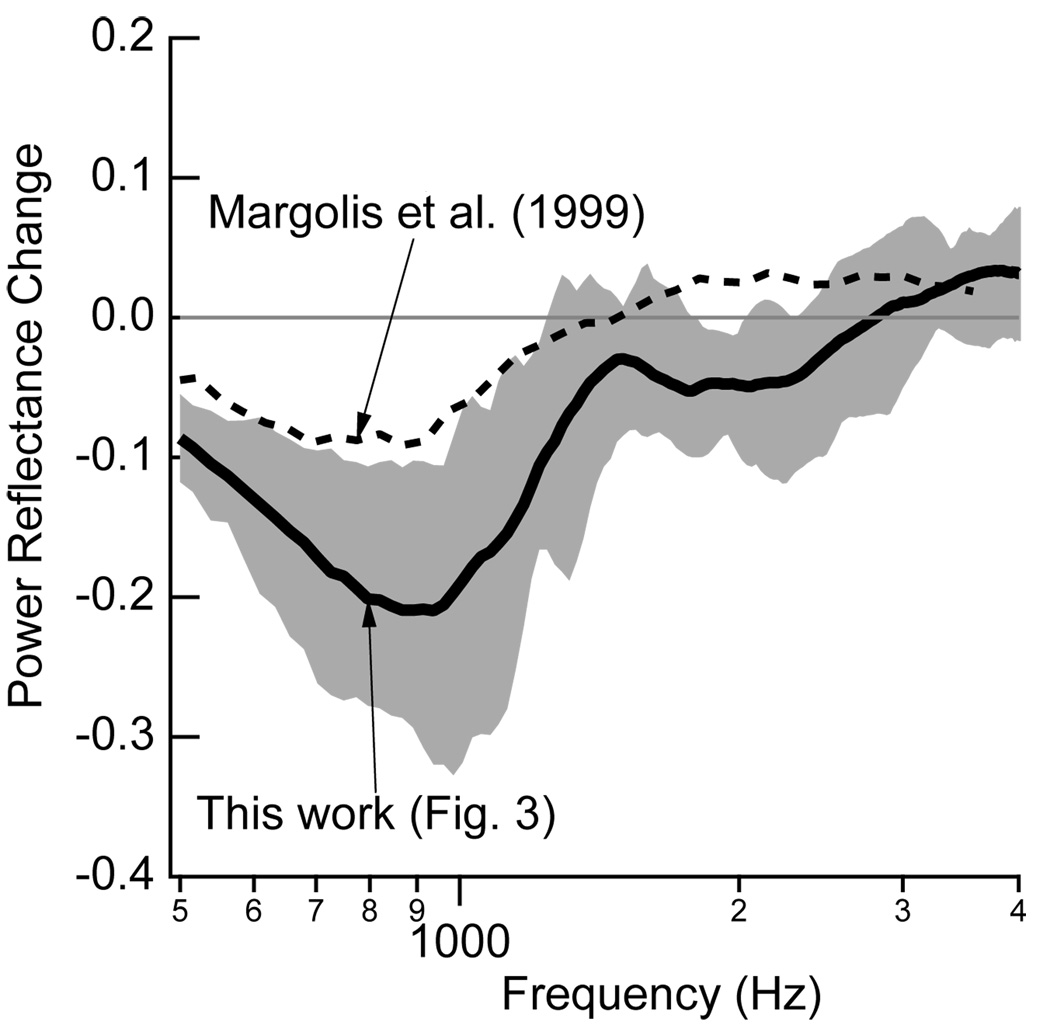
Several studies have demonstrated that the auditory system is sensitive to changes in posture, presumably through changes in intracranial pressure (ICP) that in turn alter the intracochlear pressure, which affects the stiffness of the middle-ear system. This observation has led to efforts to develop an ear-canal based noninvasive diagnostic measure for monitoring ICP, which is currently monitored invasively via access through the skull or spine. Here, we demonstrate the effects of postural changes, and presumably ICP changes, on distortion product otoacoustic emissions (DPOAE) magnitude, DPOAE angle, and power reflectance. Measurements were made on 12 normal-hearing subjects in two postural positions: upright at 90 degrees and tilted at -45 degrees to the horizontal. Measurements on each subject were repeated five times across five separate measurement sessions. All three measures showed significant changes (p<0.001) between upright and tilted for frequencies between 500 and 2000 Hz, and DPOAE angle changes were significant at all measured frequencies (500-4000 Hz). Intra-subject variability, assessed via standard deviations for each subject's multiple measurements, were generally smaller in the upright position relative to the tilted position.


Figures

Figure 1
Figure 1
Middle-ear pressures measured as tympanic peak pressure (TPP) via tympanometry. Measurements are offset slightly on the x-axis in the order they were taken; for a given ear, the upright measurement made first is furthest to the left and the corresponding tilted measurement is also furthest to the left. All ears have four or five middle-ear pressure measurements. Ears with all measurements available have five data points for each position (upright and tilted), and those with DPOAE and reflectance measurement sessions that were determined to be corrupted by high distortion levels are not included here (see methods section 2.6). The tympanometer reports TPP with a resolution of 6 daPa. The gray shaded region indicates TPP within ±25 daPa of zero.
Figure 2
Figure 2
DPOAE magnitudes (upper row), DPOAE angles (middle row) and power reflectance (lower row) from the left ears of Subject 4 (left column), Subject 9 (middle column), and Subject 11 (right column). Measurements plotted in black correspond to the upright position, and those plotted in gray correspond to the subject tilted at −45° to the horizontal with an estimated ICP on the order of 22 mm Hg (about 30 cm H20 or 293 daPa). The maximum noise floor measured for each subject at each frequency across all measurement sessions is plotted in dashed lines on the magnitude plots. Noise levels are generally higher at low frequencies for upright postures (black dashed lines) because the measurements were stopped once the signal-to-noise level reached 15 dB. All DPOAE data with a magnitude within 6 dB of the noise floor were assumed to be corrupted by noise and were not plotted. The DPOAE magnitudes and angles are plotted as a function of the frequency f2.
Figure 3
Figure 3
Mean changes (upper row) and the corresponding p values (lower row) for each individual ear in DPOAE magnitudes (left), DPOAE angles (middle), and power reflectance (right) between the upright and tilted positions. The DPOAE magnitudes and angles and corresponding p values are plotted as a function of the frequency f2. UPPER ROW: The difference between the upright and tilted quantity was calculated for each measurement. For each subject, the mean of the differences was calculated and plotted in either thin solid lines (9 ears) or dashed lines (3 ears). The dashed lines correspond to three ears that include 11 of the 14 largest changes in middle-ear pressure (|ΔMEP| > 50daPa). The group means calculated from the individual’s means plotted on each graph is indicated by a thick black line, and the 25 to 75% range of all individual means is indicated by the regions shaded gray. For all cases, means were only calculated at frequencies where three or more data points exist. LOWER ROW: Computed p values to test the hypothesis that data collected at the two postural positions are different. Individual p values were calculated for each subject at each frequency. Thin solid and dashed lines (pressure outliers described above) represent p values for individual ears, the region shaded gray is the range for 25 to 75% of the ears, and the thick black line is the median p value at each frequency. Values were computed with a permutation test with 10,000 iterations and replacement.
Figure 4
Figure 4
Standard deviations calculated for DPOAE magnitudes (upper row), angles (middle row), and power reflectance (lower row) for upright (left column) and tilted (right column) postures. For each subject and each posture, a standard deviation was calculated at all frequencies where three or more data points existed from repeated measurements. Reasons for less than three include the elimination of data affected by either distortion or noise. The individual standard deviations from separate ears are plotted with dotted lines; the mean standard deviation for each condition at each frequency is indicated by the thick black line; and the 25 to 75% range of data is indicated by the region shaded gray. The DPOAE magnitudes and angles are plotted as a function of the frequency f2.
Figure 5
Figure 5
Comparison of changes (upright minus tilted) in DPOAE magnitudes (left) and angles (right) between the work presented here in Fig. 3 and that presented by Büki et al. (2000). The postural changes were from upright to −45° in this work and from upright to −30° in Büki et al. (2000). The mean data from Büki et al. (2000) is represented by the dashed black line with the hashed area indicating ±1 standard deviation, and the solid black line represents a model prediction. As presented in Fig. 3, the gray line indicates the mean changes from the work here with the 25–75% range shaded in gray.
Figure 6
Figure 6
Comparison of the effects of postural changes and ear-canal static pressures on energy reflectance. The difference in energy reflectance between the upright and tilted −45° postures reported in Fig. 3 are represented by the mean measurement plotted in solid black and the 25–75% range (shaded gray). Margolis et al. (1999) report the means of measurements of reflectance made at ambient ear-canal pressure and at an ear-canal pressure compensated to match the tympanic peak pressure measured via tympanometry. These reflectance measurements were extracted from Fig. 7 of Margolis et al. (1999), converted to energy reflectance, and the difference between the two conditions (compensated minus ambient) is plotted in the dashed line.

References

    1. Beattie RC, Kenworthy OT, Luna CA. Immediate and short-term reliability of distortion-product otoacoustic emissions. Int. J. Audiol. 2003;42:348–354. - PubMed
    1. Büki B, Avan P, Lemaire JJ, Dordain M, Chazal J, Ribari O. Otoacoustic emissions: A new tool for monitoring intracranial pressure changes through stapes displacements. Hear. Res. 1996;94:125–139. - PubMed
    1. Büki B, Chomicki A, Dordain M, Lemaire JJ, Wit HP, Chazal J, Avan P. Middle-ear influence on otoacoustic emissions. II: contributions of posture and intracranial pressure. Hear. Res. 2000;140:202–211. - PubMed
    1. Büki B, de Kleine E, Wit HP, Avan P. Detection of intracochlear and intracranial pressure changes with otoacoustic emissions: A gerbil model. Hear. Res. 2002;167:180–191. - PubMed
    1. Büki B, Giraudet F, Avan P. Non-invasive measurements of intralabyrinthine pressure changes by electrocochleography and otoacoustic emissions. Hear. Res. 2009;251:51–59. - PubMed

Publication types

LinkOut - more resources