. 2010 May 14;285(20):15119-15125.
doi: 10.1074/jbc.M109.069427. Epub 2010 Mar 12.

Co-regulation of caveolar and Cdc42-dependent fluid phase endocytosis by phosphocaveolin-1

Affiliations

Co-regulation of caveolar and Cdc42-dependent fluid phase endocytosis by phosphocaveolin-1

Zhi-Jie Cheng et al. J Biol Chem. .

Abstract

Several clathrin-independent endocytosis mechanisms have been identified that can be distinguished by specific requirements for certain proteins, such as caveolin-1 (Cav1) and the Rho GTPases, RhoA and Cdc42, as well as by specific cargo. Some endocytic pathways may be co-regulated such that disruption of one pathway leads to the up-regulation of another; however, the underlying mechanisms for this are unclear. Cav1 has been reported to function as a guanine nucleotide dissociation inhibitor (GDI), which inhibits Cdc42 activation. We tested the hypothesis that Cav1 can regulate Cdc42-dependent, fluid phase endocytosis. We demonstrate that Cav1 overexpression decreases fluid phase endocytosis, whereas silencing of Cav1 enhances this pathway. Enhancement of Cav1 phosphorylation using a phosphatase inhibitor reduces Cdc42-regulated pinocytosis while stimulating caveolar endocytosis. Fluid phase endocytosis was inhibited by expression of a putative phosphomimetic mutant, Cav1-Y14E, but not by the phospho-deficient mutant, Cav1-Y14F. Overexpression of Cav2, or a Cav1 mutant in which the GDI region was altered to the corresponding sequence in Cav2, did not suppress fluid phase endocytosis. These results suggest that the Cav1 expression level and phosphorylation state regulates fluid phase endocytosis via the interaction between the Cav1 GDI region and Cdc42. These data define a novel molecular mechanism for co-regulation of two distinct clathrin-independent endocytic pathways.


Figures
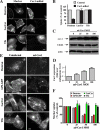
FIGURE 1.
FIGURE 1.
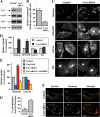
Cav1 overexpression inhibits fluid phase uptake. A and B, cells were transfected with Cav1-mRed for 24 h. Internalization (5 min at 37 °C) of AF488-dextran, -Tfn, and -Bodipy-LacCer in transfected cells (identified by mRed fluorescence and outlined by dashed white lines) and untransfected cells (Control) was performed as described (18), observed by fluorescence microscopy (A), and quantified by image analysis (B). Bar, 10 μm. Values are means ± S.D. (n ≥ 50 cells from three independent experiments). C–F, CHO-K1 cells were either uninfected (control) or infected for 48 h with a recombinant adenovirus-expressing Cav1 (Ad-Cav1) at the indicated MOI (C). Expression of total Cav1 (overexpressed and endogenous Cav1), Cdc42, and actin were determined by immunoblotting in cells infected Ad-Cav1 at various MOI (D). Cav1 levels on immunoblots as in C were quantified relative to endogenous Cav1 (0 Ad-Cav1). Values are means ± S.D. (n = 3 independent experiments). E, CHO-K1 cells were uninfected (0 Ad-Cav1) or infected with Ad-Cav1 at an MOI of 1:100 for 48 h. Internalization of fluorescently labeled dextran, LacCer, and Tfn was measured after 5 min at 37 °C as in A. GPI-GFP internalization was measured using an AF594-labeled anti-GFP-Fab. Cells were treated with phosphatidylinositol phospholipase C to remove surface GPI-GFP before acquiring fluorescence images. Bar, 10 mm. F, quantitation of internalization of markers in CHO-K1 cells as in E infected with Ad-Cav1, relative to uninfected control cells. Marker uptake was quantified by image analysis. Values are means ± S.E. (n ≥ 60 cells from three independent experiments) and are expressed relative to the extent of endocytosis for the same marker seen in uninfected control cells.
FIGURE 2.
FIGURE 2.
Cav1 silencing stimulates fluid phase uptake. CHO-K1 cells were transfected with or without siRNA against Cav1 for 5 days. A, cell lysates were prepared, and equal amounts of protein were subjected to SDS-PAGE. Expression of Cav1, Cdc42, clathrin heavy chain (CHC), and actin were determined by immunoblotting in three independent experiments. Shown are representative blots. B, shown is the quantitation of the number of surface-connected 50–80-nm vesicles in control and cells transfected with Cav1 siRNA. Samples were stained with ruthenium red (to identify PM invaginations), fixed, sectioned vertically to the culture dish, and processed for transmission electron microscopy (7). Values represent the number of 50–80-nm surface-connected vesicles within 0.5 μm of the cell surface per 100 μm of perimeter length. A total of 15 different cells were analyzed for each condition in two independent experiments. C and D, internalization of fluorescently labeled dextran, LacCer, Tfn, or GPI-GFP was measured after 5 min at 37 °C (see under “Experimental Procedures”). Noninternalized markers were removed from the PM by back exchange with defatted bovine serum albumin (DF-BSA) (for Bodipy-LacCer), by acid stripping (for AF594-labeled Tfn) or by phosphatidylinositol phospholipase C treatment (for GPI-GFP) before acquiring fluorescence images. Marker internalization relative to untransfected cells (control) was quantified by image analysis. Values are the mean ± S.D. (n ≥ 50 cells from three independent experiments). E, cells were transfected with or without siRNA against Cav1 for 5 days and infected with adenovirus encoding DN Cdc42 for the last 48 h during the transfection of Cav1 siRNA. Internalization (5 min at 37 °C) of the indicated markers was measured as in Fig. 1. Values are the mean ± S.D. (n ≥ 50 cells from three independent experiments). F and G, co-localization of Bodipy-LacCer with dextran in CHO-K1 cells. Cells, untransfected or transfected with Cav1 siRNA, were incubated with Bodipy-LacCer for 30 min at 10 °C. AF647-labeled dextran was then added, and the samples were shifted to 37 °C for 3 min, followed by back exchange (see under “Experimental Procedures”). Separate images were acquired for each fluorophore using epifluorescence microscopy, rendered in pseudocolor, and are presented as overlays. Fluorescent signals were adjusted to maximize contrast to facilitate co-localization, and intensities do not represent degree of internalization. G, co-localization was quantified by image analysis. Values are the mean ± S.E. (n ≥ 10 cells for each condition from two independent experiments). Bars in C and F, 10 μm.
FIGURE 3.
FIGURE 3.
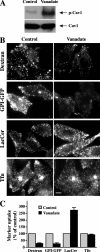
Enhanced Cav1 phosphorylation inhibits fluid phase uptake. CHO-K1 cells were untreated (control) or pretreated with 1 mm vanadate for 60 min at 37 °C. A, cell lysates were collected and immunoblotted with anti-p-Cav1(Tyr14) or anti-Cav1 antibodies. B, internalization of endocytic markers was observed after 1 min (lactosylceramide, LacCer) or 5 min (all other markers) at 37 °C in cells that were untreated or pretreated with vanadate. Bar, 10 μm. C, quantitation of marker internalization as in B, relative to untreated cells (control) by image analysis. Values are the mean ± S.E. (n ≥ 50 cells from three independent experiments).
FIGURE 4.
FIGURE 4.
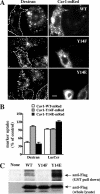
Cav1 phosphorylation at Tyr14 is required for inhibition of the fluid phase pathway. A and B, cells were transfected with Cav1-WT-mRed, Cav1-Y14F-mRed, or Cav1-Y14E-mRed constructs. Internalization (5 min at 37 °C) of AF488-labeled dextran in transfected cells (identified by mRed fluorescence and outlined by dashed white lines) relative to untransfected cells (Control) was observed by fluorescence microscopy (A) and quantified by image analysis (B) (mean ± S.E., n ≥ 30 cells for each condition). Bar, 10 μm. C, cells were untransfected or transfected with Cav1-WT-FLAG, Cav1-Y14F-FLAG, or Cav1-Y14E-FLAG for 48 h. Cells were then lysed and incubated with purified GST-Cdc42 for 2 h at 4 °C. Total Cav1 WT and its mutants in the cell lysates or pulled down by purified GST-Cdc42 were determined by Western blotting.
FIGURE 5.
FIGURE 5.
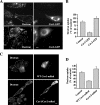
Effect of Cav1, Cav2, and a Cav1/Cav2 chimera on fluid phase uptake. Cells were transfected with (A and B) WT Cav1-GFP or Cav2-GFP, or (C and D) WT Cav1-mRed or a Cav1/Cav2-mRed chimera in which the GDI region of Cav1 is replaced with the corresponding sequence from Cav2 (see supplemental Fig. S2) for 24 h. Internalization (5 min at 37 °C) of fluorescent dextran in transfected cells (determined by GFP or mRed fluorescence and outlined by dashed white lines) relative to untransfected cells (control) was observed by fluorescence microscopy and quantified by image analysis. Values are the mean ± S.E. (n ≥ 30 cells for each condition). Bars, 10 μm.
FIGURE 6.
FIGURE 6.
Working model for co-regulation of caveolar and fluid phase endocytosis. A, conditions that increase the levels of p-Cav1, such as Cav1 overexpression or treatment of cells with phosphatase inhibitors, lead to increased association of p-Cav1 with Cdc42, holding Cdc42 in the inactive, GDP-bound form. Thus, upon increased levels of p-Cav1, Cdc42-dependent fluid phase endocytosis is inhibited. Increased p-Cav1 is also associated with higher levels of caveolar endocytosis. B, under conditions where p-Cav1 levels are decreased, such as during Cav1 knockdown, Cdc42 is less associated with p-Cav1 and is thus able to be converted to the active, GTP-bound form. Thus, Cdc42-dependent endocytosis is increased, whereas decreased p-Cav1 or total Cav1 levels lead to decreased uptake via caveolae.

Similar articles

Cited by

References

    1. Mayor S., Pagano R. E. (2007) Nat. Rev. Mol. Cell Biol. 8, 603–612 - PMC - PubMed
    1. Nichols B. J., Lippincott-Schwartz J. (2001) Trends Cell Biol. 11, 406–412 - PubMed
    1. Parton R. G., Simons K. (2007) Nat. Rev. Mol. Cell Biol. 8, 185–194 - PubMed
    1. Henley J. R., Krueger E. W., Oswald B. J., McNiven M. A. (1998) J. Cell Biol. 141, 85–99 - PMC - PubMed
    1. Oh P., McIntosh D. P., Schnitzer J. E. (1998) J. Cell Biol. 141, 101–114 - PMC - PubMed

Publication types

LinkOut - more resources