The association between atopy and childhood/adolescent leukemia: a meta-analysis
- PMID: 20228139
- PMCID: PMC2877483
- DOI: 10.1093/aje/kwq004
The association between atopy and childhood/adolescent leukemia: a meta-analysis
Abstract
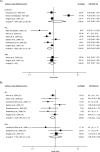
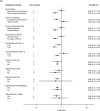
Atopic disease is hypothesized to be protective against several malignancies, including childhood/adolescent leukemia. To summarize the available epidemiologic evidence, the authors performed a meta-analysis of associations between atopy/allergies, asthma, eczema, hay fever, and hives and childhood/adolescent leukemia, acute lymphoblastic leukemia (ALL), and acute myeloid leukemia (AML). They searched MEDLINE literature (1952-March 2009) and queried international experts to identify eligible studies. Ten case-control studies were included. Summary odds ratios and 95% confidence intervals were computed via random-effects models. Odds ratios for atopy/allergies were 1.42 (95% confidence interval (CI): 0.60, 3.35) for 3 studies of leukemia overall, 0.69 (95% CI: 0.54, 0.89) for 6 studies of ALL, and 0.87 (95% CI: 0.62, 1.22) for 2 studies of AML, with high levels of heterogeneity detected for leukemia overall and ALL. Inverse associations were observed for ALL and asthma (odds ratio (OR) = 0.79, 95% CI: 0.61, 1.02), eczema (OR = 0.74, 95% CI: 0.58, 0.96), and hay fever (OR = 0.55, 95% CI: 0.46, 0.66) examined separately. Odds ratios for ALL differed by study design, exposure data source, and latency period, indicating that these factors affect study results. These results should be interpreted cautiously given the modest number of studies, substantial heterogeneity, and potential exposure misclassification but are useful in designing future research.
Figures


Similar articles
-
Atopic disease and childhood acute lymphoblastic leukemia.Int J Cancer. 2003 Jun 10;105(2):255-60. doi: 10.1002/ijc.11054. Int J Cancer. 2003. PMID: 12673688
-
Childhood acute leukemia, early common infections, and allergy: The ESCALE Study.Am J Epidemiol. 2010 Nov 1;172(9):1015-27. doi: 10.1093/aje/kwq233. Epub 2010 Aug 31. Am J Epidemiol. 2010. PMID: 20807738
-
Birth order, atopy, and risk of non-Hodgkin lymphoma.J Natl Cancer Inst. 2005 Apr 20;97(8):587-94. doi: 10.1093/jnci/dji098. J Natl Cancer Inst. 2005. PMID: 15840881
-
The long-term effects of breastfeeding on asthma and atopic disease.Adv Exp Med Biol. 2009;639:237-51. doi: 10.1007/978-1-4020-8749-3_17. Adv Exp Med Biol. 2009. PMID: 19227546 Review.
-
Tobacco smoke exposure and the risk of childhood acute lymphoblastic leukemia and acute myeloid leukemia: A meta-analysis.Medicine (Baltimore). 2019 Jul;98(28):e16454. doi: 10.1097/MD.0000000000016454. Medicine (Baltimore). 2019. PMID: 31305478 Free PMC article.
Cited by
-
Allergies and Childhood Acute Lymphoblastic Leukemia: A Case-Control Study and Meta-analysis.Cancer Epidemiol Biomarkers Prev. 2018 Oct;27(10):1142-1150. doi: 10.1158/1055-9965.EPI-17-0584. Epub 2018 Aug 1. Cancer Epidemiol Biomarkers Prev. 2018. PMID: 30068517 Free PMC article.
-
Hypothetical Atopic Dermatitis-Myeloproliferative Neoplasm Syndrome.Front Immunol. 2015 Aug 24;6:434. doi: 10.3389/fimmu.2015.00434. eCollection 2015. Front Immunol. 2015. PMID: 26379670 Free PMC article. Review.
-
Residential proximity to agriculture and risk of childhood leukemia and central nervous system tumors in the Danish national birth cohort.Environ Int. 2020 Oct;143:105955. doi: 10.1016/j.envint.2020.105955. Epub 2020 Jul 22. Environ Int. 2020. PMID: 32711331 Free PMC article.
-
Epidemiology: allergy history, IgE, and cancer.Cancer Immunol Immunother. 2012 Sep;61(9):1493-510. doi: 10.1007/s00262-011-1180-6. Epub 2011 Dec 20. Cancer Immunol Immunother. 2012. PMID: 22183126 Free PMC article. Review.
-
Comorbidities of Atopic Dermatitis: Beyond Rhinitis and Asthma.Curr Dermatol Rep. 2017;6(1):35-41. doi: 10.1007/s13671-017-0168-7. Epub 2017 Jan 21. Curr Dermatol Rep. 2017. PMID: 28890845 Free PMC article. Review.
References
-
- Linabery AM, Ross JA. Trends in childhood cancer incidence in the U.S. (1992–2004) Cancer. 2008;112(2):416–432. - PubMed
-
- Ries LAG, Smith MA, Gurney JG, et al., editors. Cancer Incidence and Survival Among Children and Adolescents: United States SEER Program 1975–1995. Bethesda, MD: National Cancer Institute; 1999. (NIH publication no. 99-4649)
-
- Turner MC, Chen Y, Krewski D, et al. An overview of the association between allergy and cancer. Int J Cancer. 2006;118(12):3124–3132. - PubMed
-
- Asher MI, Montefort S, Björkstén B, et al. Worldwide time trends in the prevalence of symptoms of asthma, allergic rhinoconjunctivitis, and eczema in childhood: ISAAC Phases One and Three repeat multicountry cross-sectional surveys. Lancet. 2006;368(9537):733–743. - PubMed
-
- National Center for Health Statistics, Centers for Disease Control and Prevention. Health Data Interactive. Allergic Conditions, Ages 0–17: US, 1999–2007 (Source: NHIS) [electronic database] Hyattsville, MD: National Center for Health Statistics; 2008. ( http://www.cdc.gov/nchs/hdi.htm). (Accessed July 9, 2009)
Publication types
MeSH terms
Grants and funding
LinkOut - more resources
Full Text Sources
Medical

