. 2010 Jun;38(6):988-94.
doi: 10.1124/dmd.109.031831. Epub 2010 Mar 12.

A comparison of whole genome gene expression profiles of HepaRG cells and HepG2 cells to primary human hepatocytes and human liver tissues

Affiliations

A comparison of whole genome gene expression profiles of HepaRG cells and HepG2 cells to primary human hepatocytes and human liver tissues

Steven N Hart et al. Drug Metab Dispos. 2010 Jun.

Abstract

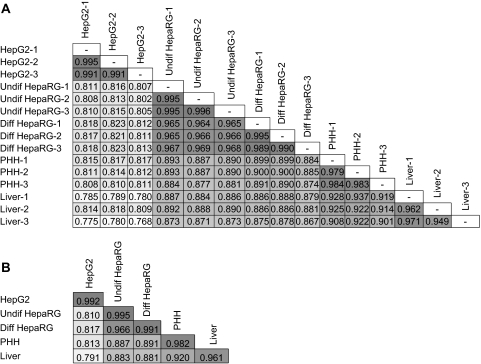
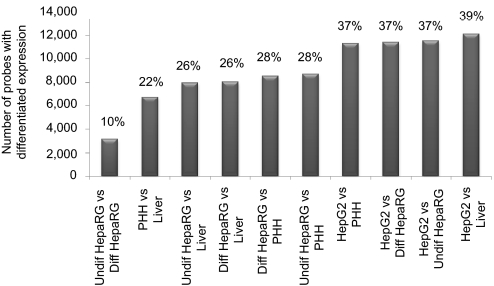
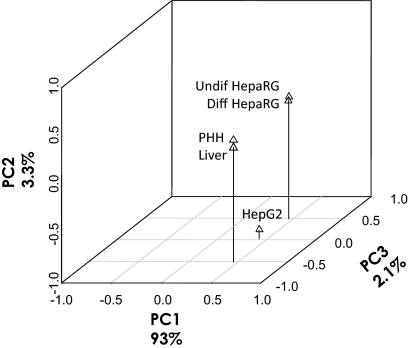
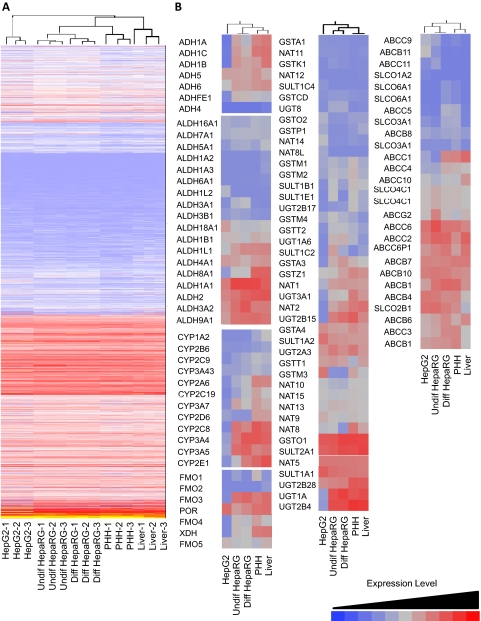
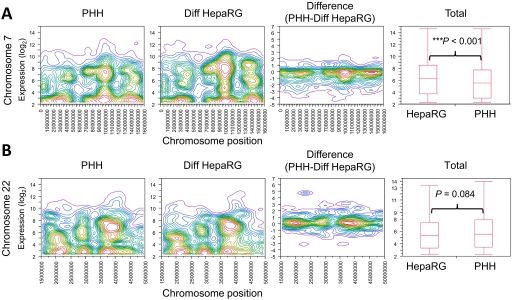
HepaRG cells, derived from a female hepatocarcinoma patient, are capable of differentiating into biliary epithelial cells and hepatocytes. More importantly, differentiated HepaRG cells are able to maintain activities of many xenobiotic-metabolizing enzymes, and expression of the metabolizing enzyme genes can be induced by xenobiotics. The ability of these cells to express and induce xenobiotic-metabolizing enzymes is in stark contrast to the frequently used HepG2 cells. The previous studies have mainly focused on a set of selected genes; therefore, it is of significant interest to know the extent of similarity of gene expression at whole genome levels in HepaRG cells and HepG2 cells compared with primary human hepatocytes and human liver tissues. To accomplish this objective, we used Affymetrix (Santa Clara, CA) U133 Plus 2.0 arrays to characterize the whole genome gene expression profiles in triplicate biological samples from HepG2 cells, HepaRG cells (undifferentiated and differentiated cells), freshly isolated primary human hepatocytes, and frozen liver tissues. After using similarity matrix, principal components, and hierarchical clustering methods, we found that HepaRG cells globally transcribe genes at levels more similar to human primary hepatocytes and human liver tissues than HepG2 cells. In particular, many genes encoding drug-processing proteins are transcribed at a more similar level in HepaRG cells than in HepG2 cells compared with primary human hepatocytes and liver samples. The transcriptomic similarity of HepaRG with primary human hepatocytes is encouraging for use of HepaRG cells in the study of xenobiotic metabolism, hepatotoxicology, and hepatocyte differentiation.


Figures

Fig. 1.
Fig. 1.
A, similarity matrix of gene expression profiles for each pairwise comparison of HepG2 cells (HepG2-1, -2, -3), undifferentiated HepaRG cells (Undif HepaRG-1, -2, -3), differentiated HepaRG cells (Diff HepaRG-1, -2, -3), primary human hepatocytes (PHH-1, -2, -3), and human liver tissues (Liver-1, -2, -3). The number in each column represents Pearson's product-moment correlation coefficient r value. B, average correlation coefficient r values for each type of the biological replicates within each group and between two groups. Data based on 30,849 probe sets passing a quality-filtering test. The background colors in each column indicate different levels of the r values.
Fig. 2.
Fig. 2.
Numbers and percentages of probe sets with differential gene expression by more than 2-fold between any two groups of the samples. The comparison was based on average signal intensities on each set of the probes from three replicates in each group of the samples.
Fig. 3.
Fig. 3.
Principal component analysis on variations of gene transcription among HepG2 cells (HepG2), undifferentiated HepaRG cells (Undif HepaRG), differentiated HepaRG cells (Diff HepaRG), primary human hepatocytes (PHH), and liver tissues (Liver). For the 30,849 probes passing quality filtering, the relative contribution of the variance is shown by three major principal components plotted in three dimensions.
Fig. 4.
Fig. 4.
A, hierarchical clustering analysis of gene expression for HepG2 cells (HepG2-1, -2, -3), undifferentiated HepaRG cells (Undif HepaRG-1, -2, -3), differentiated HepaRG cells (Diff HepaRG-1, -2, -3), primary human hepatocytes (PHH-1, -2, -3), and human liver tissues (Liver-1, -2, -3). The clustering is based on the 30,849 probes passing quality filtering. B, hierarchical clustering analysis of expression of Phase I drug-metabolizing enzyme genes (ADHs, ALDHs, P450s, and FMOs), Phase II drug-metabolizing enzyme genes (GSTs, NATs, SULTs, and UGTs), and membrane transporter genes (ABCBs, ABCCs, ABCGs, and SLCOs). The clustering is based on average signal intensities from the three replicates in each group of the samples.
Fig. 5.
Fig. 5.
Comparison of gene expression profiles across chromosomes 7 (A) and 22 (B) between primary human hepatocytes (PHH) and differentiated HepaRG cells (Diff HepaRG). In the first two panels, the y-axis represents the signal intensity levels in log2 scale, and the x-axis indicates the genomic positions along the chromosomes where the microarray probes are located for PHH and Diff HepaRG, respectively. The third panel was constructed by subtracting PHH values from Diff HepaRG signal values for each probe on the chromosome and then clustered as in the first two panels. For example, if the expression of a given probe was 5 in PHH and 3 in Diff HepaRG, then that value would be 5 − 3 = 2. Negative values indicate probes with lower expression in PHH than Diff HepaRG. Blue areas represent few data points, whereas red areas indicate more data points. In the fourth panel, signal intensity levels from all the probes on each chromosome are compared between Diff HepaRG and PHH with mean and S.D. The differences are tested by a t test. ***, p < 0.001 indicates that a significant difference is identified between the two sets of samples.

Similar articles

Cited by

References

    1. Aninat C, Piton A, Glaise D, Le Charpentier T, Langouët S, Morel F, Guguen-Guillouzo C, Guillouzo A. (2006) Expression of cytochromes P450, conjugating enzymes and nuclear receptors in human hepatoma HepaRG cells. Drug Metab Dispos 34:75–83 - PubMed
    1. Dennis G, Jr, Sherman BT, Hosack DA, Yang J, Gao W, Lane HC, Lempicki RA. (2003) DAVID: Database for Annotation, Visualization, and Integrated Discovery. Genome Biol 4:P3 - PubMed
    1. Gripon P, Rumin S, Urban S, Le Seyec J, Glaise D, Cannie I, Guyomard C, Lucas J, Trepo C, Guguen-Guillouzo C. (2002) Infection of a human hepatoma cell line by hepatitis B virus. Proc Natl Acad Sci USA 99:15655–15660 - PMC - PubMed
    1. Guillouzo A, Corlu A, Aninat C, Glaise D, Morel F, Guguen-Guillouzo C. (2007) The human hepatoma HepaRG cells: a highly differentiated model for studies of liver metabolism and toxicity of xenobiotics. Chem Biol Interact 168:66–73 - PubMed
    1. Hewitt NJ, Lechón MJ, Houston JB, Hallifax D, Brown HS, Maurel P, Kenna JG, Gustavsson L, Lohmann C, Skonberg C, et al. (2007) Primary hepatocytes: current understanding of the regulation of metabolic enzymes and transporter proteins, and pharmaceutical practice for the use of hepatocytes in metabolism, enzyme induction, transporter, clearance, and hepatotoxicity studies. Drug Metab Rev 39:159–234 - PubMed

Publication types