. 2010 May;298(5):H1616-25.
doi: 10.1152/ajpheart.00481.2009. Epub 2010 Mar 12.

Measurement and analysis of sarcomere length in rat cardiomyocytes in situ and in vitro

Affiliations

Measurement and analysis of sarcomere length in rat cardiomyocytes in situ and in vitro

G Bub et al. Am J Physiol Heart Circ Physiol. 2010 May.

Abstract

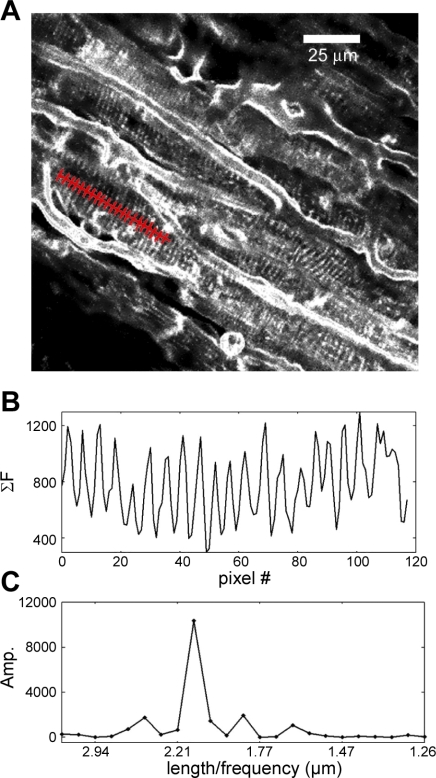
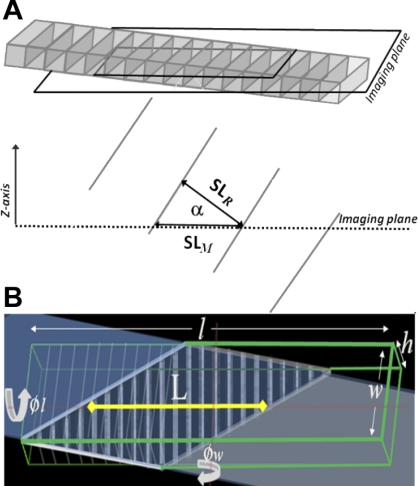
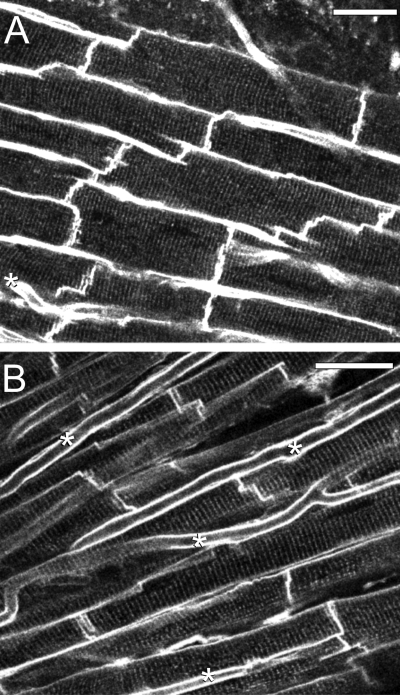
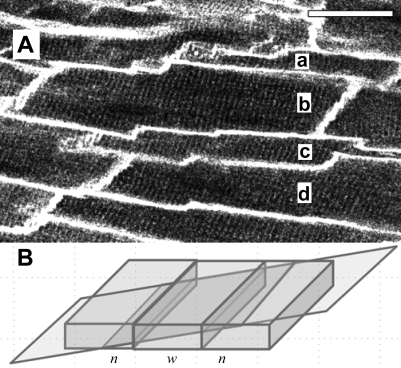
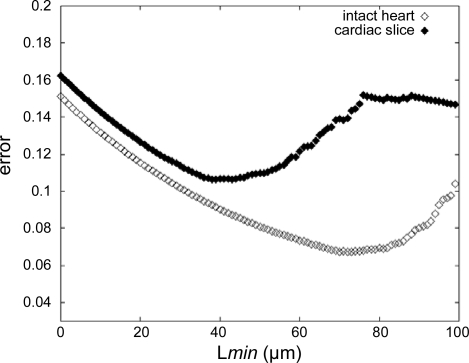
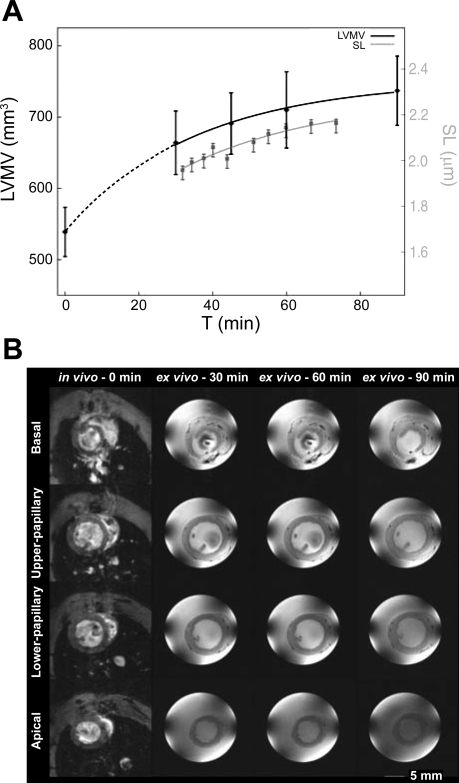
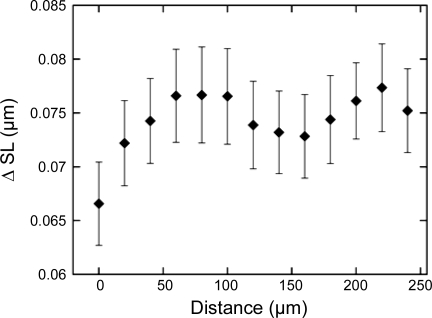
Sarcomere length (SL) is an important determinant and indicator of cardiac mechanical function; however, techniques for measuring SL in living, intact tissue are limited. Here, we present a technique that uses two-photon microscopy to directly image striations of living cells in cardioplegic conditions, both in situ (Langendorff-perfused rat hearts and ventricular tissue slices, stained with the fluorescent marker di-4-ANEPPS) and in vitro (acutely isolated rat ventricular myocytes). Software was developed to extract SL from two-photon fluorescence image sets while accounting for measurement errors associated with motion artifact in raster-scanned images and uncertainty of the cell angle relative to the imaging plane. Monte-Carlo simulations were used to guide analysis of SL measurements by determining error bounds as a function of measurement path length. The mode of the distribution of SL measurements in resting Langendorff-perfused heart is 1.95 mum (n = 167 measurements from N = 11 hearts) after correction for tissue orientation, which was significantly greater than that in isolated cells (1.71 mum, n = 346, N = 9 isolations) or ventricular slice preparations (1.79 mum, n = 79, N = 3 hearts) under our experimental conditions. Furthermore, we find that edema in arrested Langendorff-perfused heart is associated with a mean SL increase; this occurs as a function of time ex vivo and correlates with tissue volume changes determined by magnetic resonance imaging. Our results highlight that the proposed method can be used to monitor SL in living cells and that different experimental models from the same species may display significantly different SL values under otherwise comparable conditions, which has implications for experiment design, as well as comparison and interpretation of data.


Figures

Fig. 1.
Fig. 1.
Sarcomere length (SL) measurement software operation. A: image sets from 1-(3-sulfonatopropyl)-4-{β-[2-(di-N-butylamino)-6-naphthyl]vinyl}pyridinium betaine (di-4-ANEPPS)-labeled tissue are obtained using a two-photon microscope. A user-defined path, restricted by cell boundaries and entered nearly perpendicular to the striation pattern, is shown in red. B: intensity profile of the user-drawn path. Intensity values are summed for pixels perpendicular to the user path (3 pixels for each point) and plotted as shown (see methods). C: discrete Fourier transform (DFT) of the intensity profile in B.
Fig. 2.
Fig. 2.
A: schematic illustration of how cell angle relative to the two-photon fluorescence image plane (α) affects apparent (measured) SL (SLM). The cell is rotated about the rotational axis through the cell center aligned with cell width. The cell's real SL (SLR) is a function of SLM and α. B: a diagrammatic representation of a cell (outlined by the green lines) with dimensions length (l) width (w), and height (h) and rotated by 15 and 25 degrees around the rotational axes through the cell center aligned with the cell width (ϕw) and length (ϕl), respectively, shown relative to the imaging plane (shaded section). The appearance of the cell in the image plane is given by the trapezoid (bold white lines).
Fig. 3.
Fig. 3.
Two-photon fluorescence images of di-4-ANEPPS-stained myocardium of a Langendorff-perfused rat heart displaying two different morphologies. A: cells in a densely packed tissue assembly. B: cells in a loosely packed tissue assembly. Capillaries (*) are more frequently visualized in loosely packed tissue. Scale bars are 30 μm in both panels.
Fig. 4.
Fig. 4.
A: cells a-d display an alternating narrow-wide-narrow pattern of apparent cell morphology (scale bar 30 μm). B: the pattern observed in A can be explained by the angle of the two-photon fluorescence image plane relative to tissue orientation in a modeled densely packed layer of cells, which yields a similar narrow-wide-narrow (n, w, n) pattern.
Fig. 5.
Fig. 5.
Error bounds estimate for the intact heart (◊) and cardiac slice (♦) preparations. The magnitude of the error is calculated based on the no. of actual measurements, available in a given data set, with longest line perpendicular to the striation patterns within cell boundaries (L) ≥ minimum cell length in the image plane (Lmin).
Fig. 6.
Fig. 6.
SL and tissue volume changes as a function of experimental time. A: the first SL measurement is taken at 30 min post-heart extraction (gray curve, see y-axis on right). Tissue volume shows a similar change with time (black line, see y-axis on left); the 0 time point measurement has been taken from the same heart before excision [in vivo magnetic resonance image (MRI) scan]. LVMV, left ventricular myocardial volume. B: MRI of a heart in vivo (first column) and ex vivo as a Langendorff-perfused cardioplegically arrested preparation [time (t) = 30, 60, and 90 min]. Images from different axial planes from basal (1st row) to upper papillary (2nd row) and lower papillary (3rd row) levels and near apical plane (4th row).
Fig. 7.
Fig. 7.
Difference between SL measurements (ΔSL) as a function of distance between measurement sites within an image. Distance is calculated as the minimum distance between user-defined measurement paths. Error bars are in units of SE.

Similar articles

Cited by

References

    1. Aistrup GL, Shiferaw Y, Kapur S, Kadish A, Wasserstrom JA. Mechanism underlying the formation and dynamics of subcellular calcium alternans in the intact rat heart. Circ Res 104: 639–649, 2009 - PubMed
    1. Bassien-Capsa V, Fouron JC, Comte B, Chorvatova A. Structural, functional and metabolic remodeling of rat left ventricular myocytes in normal and in sodium-supplemented pregnancy. Cardiovasc Res 69: 423–431, 2006 - PubMed
    1. Bers DM. Ca influx and sarcoplasmic reticulum Ca release in cardiac muscle activation during postrest recovery. Am J Physiol Heart Circ Physiol 248: H366–H381, 1985 - PubMed
    1. Boulesteix T, Beaurepaire E, Sauviat MP, Schanne-Klein MC. Second-harmonic microscopy of unstained living cardiac myocytes: measurements of sarcomere length with 20-nm accuracy. Opt Lett 29: 2031–2033, 2004 - PubMed
    1. Burton RAB, Plank G, Schneider JE, Grau V, Ahammer H, Keeling SJ, Lee J, Smith NP, Gavaghan D, Trayanova P, Kohl N. 3-Dimensional models of individual cardiac histo-anatomy: tools and challenges. Ann NY Acad Sci 1380: 301–319, 2006 - PMC - PubMed

Publication types

Substances

LinkOut - more resources