Clinical Trial
. 2010 Jun 3;115(22):4356-66.
doi: 10.1182/blood-2009-12-257352. Epub 2010 Mar 12.

Dynamics of gene-modified progenitor cells analyzed by tracking retroviral integration sites in a human SCID-X1 gene therapy trial

Affiliations
Clinical Trial

Dynamics of gene-modified progenitor cells analyzed by tracking retroviral integration sites in a human SCID-X1 gene therapy trial

Gary P Wang et al. Blood. .

Abstract

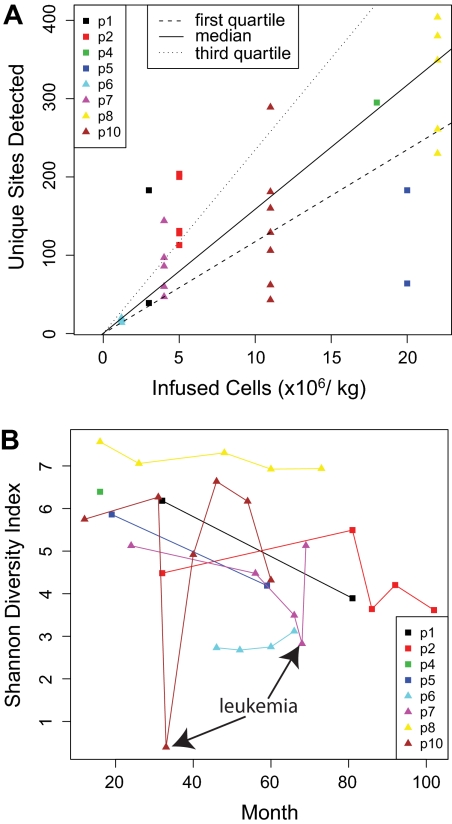
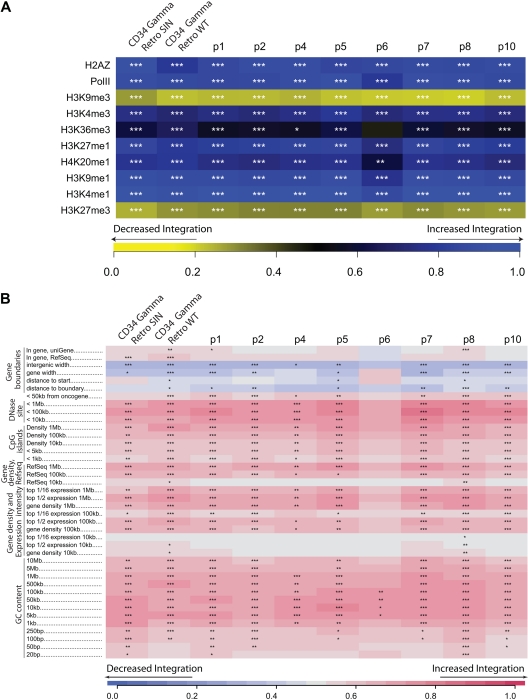
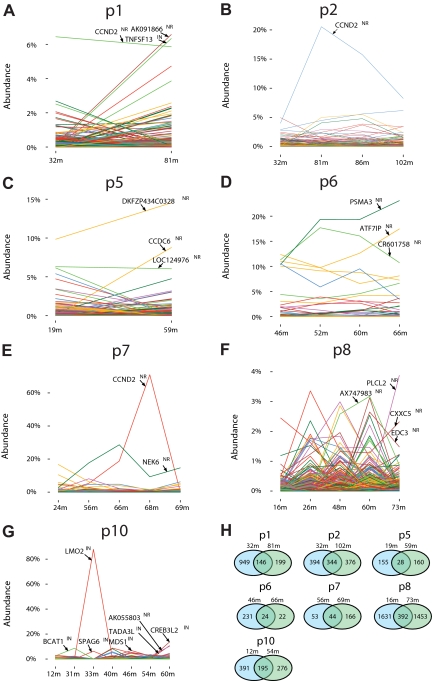
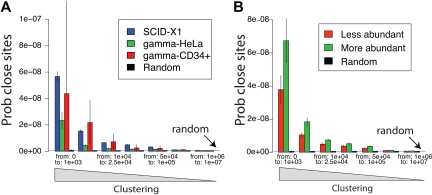
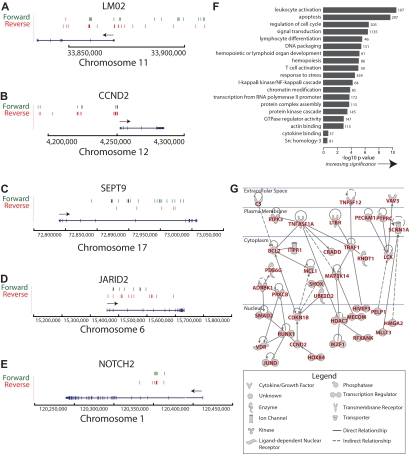
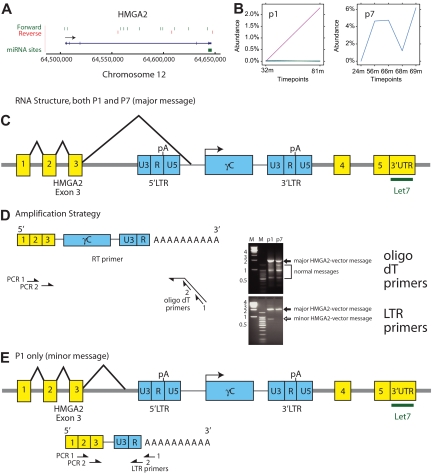
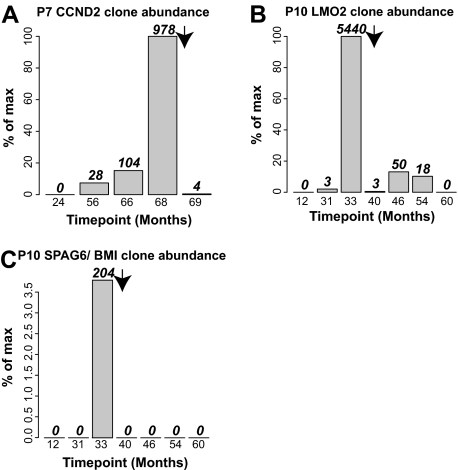
X-linked severe-combined immunodeficiency (SCID-X1) has been treated by therapeutic gene transfer using gammaretroviral vectors, but insertional activation of proto-oncogenes contributed to leukemia in some patients. Here we report a longitudinal study of gene-corrected progenitor cell populations from 8 patients using 454 pyrosequencing to map vector integration sites, and extensive resampling to allow quantification of clonal abundance. The number of transduced cells infused into patients initially predicted the subsequent diversity of circulating cells. A capture-recapture analysis was used to estimate the size of the gene-corrected cell pool, revealing that less than 1/100th of the infused cells had long-term repopulating activity. Integration sites were clustered even at early time points, often near genes involved in growth control, and several patients harbored expanded cell clones with vectors integrated near the cancer-implicated genes CCND2 and HMGA2, but remain healthy. Integration site tracking also documented that chemotherapy for adverse events resulted in successful control. The longitudinal analysis emphasizes that key features of transduced cell populations--including diversity, integration site clustering, and expansion of some clones--were established early after transplantation. The approaches to sequencing and bioinformatics analysis reported here should be widely useful in assessing the outcome of gene therapy trials.


Figures

Figure 1
Figure 1
Population structure of gene-corrected cells. (A) The number of infused cells per kilogram in each patient is shown on the x-axis. The number of unique integration sites detected at each time point is shown on the y-axis. For the comparison, only data obtained by cleaving the genome with MseI were used because this allowed a fair comparison among samples (complete data are summarized in supplemental Table 1). (B) The longitudinal trends in diversity are shown. The x-axis shows time after infusion of gene-corrected cells, and the y-axis shows diversity as quantified using the Shannon Diversity Index. Time points corresponding to the adverse events in patients no. 7 and no. 10 are marked.
Figure 2
Figure 2
Integration site abundance near epigenetic marks and genomic features. (A) Integration frequency near sites of histone posttranslational modification or bound chromatin proteins. Integration frequency is quantified relative to genome-wide mapping data in CD34+ hematopoietic stem cells studied. The integration frequency scale is shown along the bottom of the panel. Increasingly intense shades of yellow indicate negative correlation of the experimental dataset with the matched random control, and increasing shades of blue indicate positive correlation. The scale is generated using the ROC (receiver operator characteristic) area method., CTCF is a DNA-binding protein proposed to be associated with chromatin boundaries. H2AZ is a histone variant associated preferentially with promoters. For both panels, the asterisks in each tile indicate the significance of any departures from random integration; *P < .05, **P < .01, ***P < .001). The datasets marked “Retro SIN” and “Retro WT” are for gammaretroviral integration in CD34+ cells reported. (B) Integration frequency near annotated sequence features is quantified using the ROC area method. Increased integration near the indicated feature compared with random distribution is shown in red, decreased integration in blue. For many of the features, the strength of the trend was examined over several genomic length intervals. The interval lengths are shown to the right of the feature name (eg, for GC content, 1 kb indicates intervals of 1 kb around each integration site were used for analysis). Intervals marked “<” indicate measures of integration within the indicated distance of that feature. Intergenic width indicates the length of intervals between transcription units for those sites outside transcription units. The short intergenic regions (gene dense regions) indicated in blue were favored for integration. Effects of gene activity are captured in the expression intensity measure. Affymetrix expression data for lymphoid cells were used to annotate genes, then density of genes with different expression levels used to annotate integration sites as in the gene density analysis. For example, for the top 1/2 expression, the density of genes was analyzed at each integration site or random control, but only the most active 50% of genes was scored. For the top 1/16 expression, the most active 1/16th of genes was used. Because the datasets are large, in a few cases statistically significant differences were achieved for tiles where little color is evident. One anomalous dataset was excluded from the analysis as an extreme outlier (BstYI for patient no. 6).
Figure 3
Figure 3
Longitudinal analysis of the relative abundance of gene-corrected cell clones. (A-G) The proportion of cells containing each integration site is shown on the y-axis; time after gene therapy in months (m) is on the x-axis. The proportion was calculated from the sequence counts as described in supplemental Reports 2, 3, and 4. The gene names for the most abundant clones are shown within each panel. “NR” indicates near the gene, “IN,” within the gene. The adverse events in the trial were as follows, designated by patient (p) number, genes involved, and time of event: p4, LMO2, 30m; p5, LMO2, 20m; p7, CCND2, 68m; p10, LMO2 and BMI1/SPAG6, 33m. (H) Comparison of unique integration site sequences at early versus late time points. Pairs of time points were chosen so that similar sets of restriction enzymes were used for analysis, because recovery using a greater number of restriction enzymes results in recovering a greater number of sites. Thus for some of the patients the last time point was not used in favor of earlier time points with more data. Restriction enzymes used were ApoI, AvrII/NheI/SpeI, BstYI, MseI, NlaIII, and Tsp509I (patients no. 1, no. 2, no. 6, and no. 8); ApoI, AvrII/NheI/SpeI, BstYI, and MseI (patient no. 10); and AvrII/NheI/SpeI and MseI (patients no. 5 and no. 7).
Figure 4
Figure 4
Clustering of integration sites. (A) Clustering in the SCID gene-corrected samples is greater than for a gammaretroviral vector in tissue culture. Clustering was analyzed by comparing the distribution of distances between integration sites (x-axis). That is, the lengths of chromosomal segments between integration sites is measured for all pairs and tabulated. Enrichment for short distances between pairs (left side of x-axis) indicates relatively greater clustering. The probability of encountering distances of the indicated lengths by chance (Prob close sites, y-axis) was normalized for the number of sites in each set. To obtain enough control gammaretroviral integration sites for comparison, sites from various studies were pooled.,, The dataset for gammaretroviral vector integration in CD34+ cells is smaller than the others, so the uncertainty is greater (larger error bars) because of the smaller sample size. The blue horizontal line (random) represents the probability expected for random control sites. The SCID sites were significantly more clustered than those of Moloney murine leukemia virus in HeLa cells. (B) Clustering is greater for frequently isolated SCID-X1 integration sites, reflecting selective expansion of cell clones with integration sites in clusters. The distance between integration sites is shown on the x-axis, and the probability of integration site distance is shown on the y-axis. The population of unique integration sites was annotated for the frequency of sequence reads for each, then the more abundant half (green) was compared with the less abundant half (red). The more abundant sites were significantly more clustered (P ≪ .05).
Figure 5
Figure 5
Ontology and network analysis of genes at clustered integration sites. (A) Clustered integration sites at the LMO2 locus. The green and red lines indicate the position of vector integration sites. Forward indicates that the vector is oriented 5′ to 3′ relative to the chromosomal numbering system. Reverse indicates reverse orientation. The arrow indicates the direction of LMO2 transcription. Only selected splice variants are shown. Annotation similar in subsequent panels. (B) Clustered integration sites at the CCND2 locus. (C) Clustered integration sites at the SEPT9 locus. (D) Clustered integration sites at the JARID2 locus. (E) Clustered integration sites at the NOTCH2 locus. (F) Gene classes enriched near integration sites. The x-axis shows the statistical significance for enriched groups as the negative log of P after correction for multiple comparisons (Benjamini). The number at the end of each bar indicates the number of genes near integration sites in each category (categories were defined by the DAVID gene ontology). The raw ontology output was edited to remove uninformative high level classes or duplicative annotation. (G) A regulatory network defined by genes at clustered integration sites. The network was generated using Ingenuity, which uses published literature on interactions or affinity screens to link genes (solid line indicates direct relationships, dashed line indicates indirect relationships, arrow indicates directionality of the relationship). All networks are shown that involved more than 2 genes. No attempt was made to assess statistical significance of this network.
Figure 6
Figure 6
Expansion of cell clones with integrated vectors in the HMGA2 third intron. (A) Map of integration sites detected in the HMGA2 locus, pooled over all the SCID-X1 patients. The green and red lines indicate the positions of vector integration sites. Forward indicates that the vector is oriented 5′ to 3′ relative to the chromosomal numbering system. Reverse indicates reverse orientation. (B) Longitudinal expansion of cell clones harboring integration events in HMGA2 in patient no.1 and patient no. 7. The x-axis shows the time after cell infusion, the y-axis shows the reconstructed percentage of all transduced cells contributed by cells harboring the HMGA2 integration site. Note the difference in the y-axis scale compared with Figure 3. (C) Structure of the major chimeric HMGA2-vector message. The major message (splice acceptor site at bp 1992 of the vector) was found in both patients no. 1 and no. 7. An alternative splice acceptor site at bp 2002 was found in patient no. 7. (D) Amplification strategy for determining the chimeric HMGA2-vector message structure using reverse-transcription PCR. The time points were 75 months (patient no. 1) and 56 months (patient no. 7). The bands marked “major” and “minor” HMGA2-vector message formed on the ethidium-stained gel were excised and subjected to Sanger DNA sequencing. Sequence analysis established that slower mobility bands corresponded exclusively to the chimeric HMGA2-vector forms. The mobility of the forms marked normal messages matched bands seen after amplification of control samples (data not shown). (E) Deduced structure of a minor form of the chimeric HMGA2-vector message found in lesser abundance in patient no. 1 only.
Figure 7
Figure 7
Integration site sequence data document durable control of blast cell expansions by chemotherapy in patient no. 7 and patient no. 10. (A) Control of blast cells containing the CCND2 integration site in patient no. 7. (B) Control of blast cells containing the LMO2 site in patient no. 10. (C) Control of blast cells containing the SPAG6/BMI1 site in patient no. 10. Arrow indicates the time of initiation of chemotherapy.

Similar articles

Cited by

References

    1. Cavazzana-Calvo M, Hacein-Bey S, de Saint Basile G, et al. Gene therapy of human severe combined immunodeficiency (SCID)-X1 disease. Science. 2000;288(5466):669–672. - PubMed
    1. Hacein-Bey-Abina S, Le Deist F, Carlier F, et al. Sustained correction of X-linked severe combined immunodeficiency by ex vivo gene therapy. N Engl J Med. 2002;346(16):1185–1193. - PubMed
    1. Hacein-Bey-Abina S, Garrigue A, Wang GP, et al. Insertional oncogenesis in 4 patients after retrovirus-mediated gene therapy of SCID-X1. J Clin Invest. 2008;118(9):3132–3142. - PMC - PubMed
    1. Aiuti A, Slavin S, Aker M, et al. Correction of ADA-SCID by stem cell gene therapy combined with nonmyeloablative conditioning. Science. 2002;296(5577):2410–2413. - PubMed
    1. Ott MG, Schmidt M, Schwarzwaelder K, et al. Correction of X-linked chronic granulomatous disease by gene therapy, augmented by insertional activation of MDS1-EVI1, PRDM16 or SETBP1. Nat Med. 2006;12(4):401–409. - PubMed

Publication types

MeSH terms