. 2010 Apr;213(Pt 7):1060-8.
doi: 10.1242/jeb.034678.

Neuromechanical simulation of the locust jump

Affiliations

Neuromechanical simulation of the locust jump

D Cofer et al. J Exp Biol. 2010 Apr.

Abstract

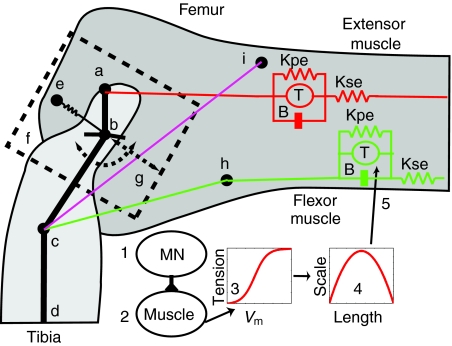
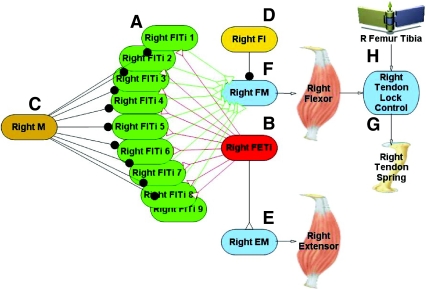
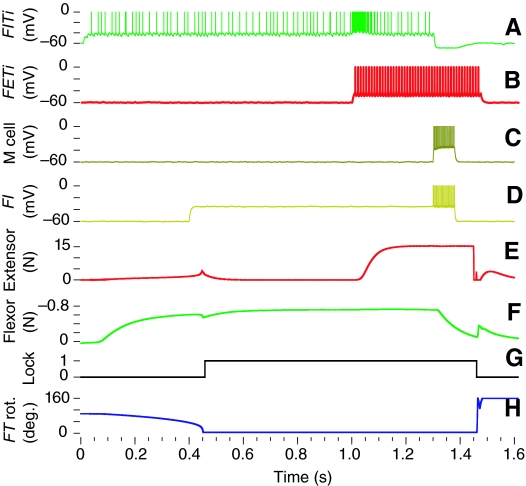
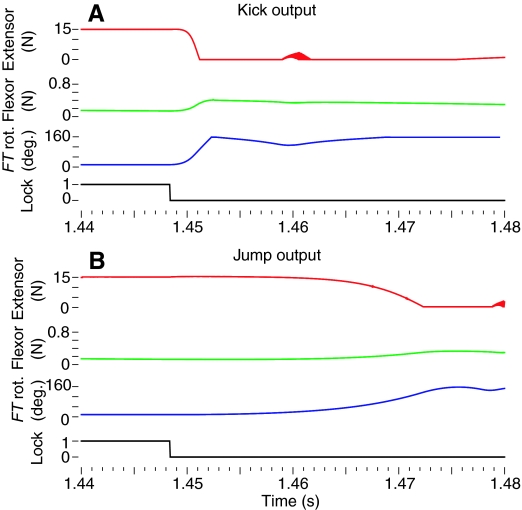
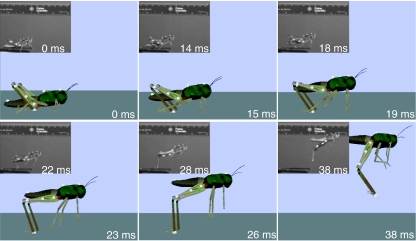
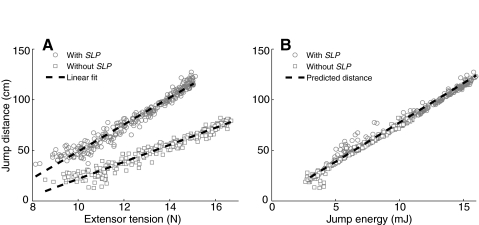
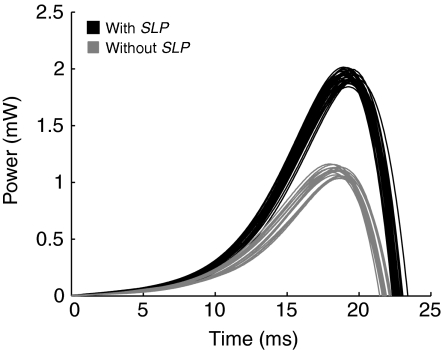
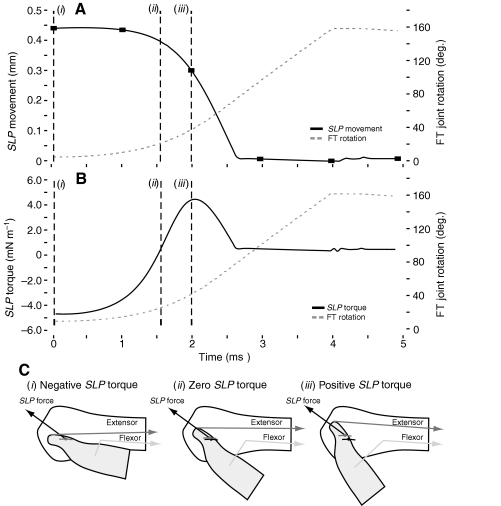
The neural circuitry and biomechanics of kicking in locusts have been studied to understand their roles in the control of both kicking and jumping. It has been hypothesized that the same neural circuit and biomechanics governed both behaviors but this hypothesis was not testable with current technology. We built a neuromechanical model to test this and to gain a better understanding of the role of the semi-lunar process (SLP) in jump dynamics. The jumping and kicking behaviors of the model were tested by comparing them with a variety of published data, and were found to reproduce the results from live animals. This confirmed that the kick neural circuitry can produce the jump behavior. The SLP is a set of highly sclerotized bands of cuticle that can be bent to store energy for use during kicking and jumping. It has not been possible to directly test the effects of the SLP on jump performance because it is an integral part of the joint, and attempts to remove its influence prevent the locust from being able to jump. Simulations demonstrated that the SLP can significantly increase jump distance, power, total energy and duration of the jump impulse. In addition, the geometry of the joint enables the SLP force to assist leg flexion when the leg is flexed, and to assist extension once the leg has begun to extend.


Figures

Fig. 1.
Fig. 1.
Model of the femur–tibia (FT) joint of the metathoracic leg. (a) Extensor apodeme attachment point on the tibia. (b) FT hinge joint and connection of semi-lunar process (SLP) spring. (c) Flexor apodeme attachment point on the tibia. (d) A more distal point on the tibia. (e) The SLP spring is attached between the femur and the tibia. (f) The SLP mass moves along the slider joint (g) oriented between the points b and g that is at an inclination of 36.9 deg. (h) Heitler's lump. The flexor muscle wraps over this lump to alter its orientation with respect to the tibia as the leg is moved. (i) The tendon lock is modeled as a spring located between points c and i (magenta line). It is only enabled when the tibia is fully flexed and flexor muscle has a tension greater than 0.15 N (Bennet-Clark, 1975; Heitler, 1974). The distance between a,b is 0.76 mm, b,c is 1.64 mm. The angle a,b,c is 144 deg. and b,c,d is 143 deg. (Heitler, 1974). The muscle model is shown for the flexor and extensor muscles. This consists of a spring (Kpe), in parallel with a tension generator (T), and a dashpot (B), in series with another spring (Kse). (1) The muscle is activated by firing of a motor neuron (MN). (2) This depolarizes the muscle membrane. (3) Changes in the membrane voltage (Vm) are converted to a tension value using a sigmoidal function. (4) The tension value is scaled based on the muscle length. (5) The scaled tension is applied to the muscle by the force generator to produce a contraction. Tibia extensor muscle/apodeme is shown as a red line, and the tibia flexor muscle/apodeme is shown in green.
Fig. 2.
Fig. 2.
Neural network model to produce the kick and jump motor programs. Network shown is for the right leg. (A) Nine fast flexor tibia motor neurons (green FlTi). FlTis synapse onto the flexor muscle membrane (light blue FM). (B) A single fast extensor tibia motor neuron (red FETi). FETi synapses onto the extensor muscle membrane (light blue EM). (C) The multimodal interneuron (gold M) inhibits the FlTis. (D) The flexor inhibitor (yellow FI) inhibits the flexor muscle. (E) Depolarization of the extensor muscle membrane causes the extensor muscle to contract. (F) Depolarization of the flexor muscle membrane causes the flexor muscle to contract. (G) The tendon lock control node (light blue) controls when the tendon lock spring is enabled based on the rotation of the tibia and the tension in the flexor muscle. (H) When the jump is triggered the femur–tibia joint rotates rapidly to produce the kick or jump.
Fig. 3.
Fig. 3.
Neural output of the jump motor network. The nine flexor motor neurons were stimulated to fire (A) during the cocking phase, which increased tension in the flexor muscle (F) and rotated the tibia into a fully flexed position (H). The extensor motor neuron FETi (B) began firing to produce co-contraction and increase flexor frequency through the central excitatory synaptic connection from FETi to FLTi. The inhibitory interneurons M (C) and flexor inhibitor (FI) (D) then began firing once the extensor had reached the desired tension level (E). This caused the tension in the flexor (F) to fall below the tendon lock threshold (G), which disabled the tendon spring. The unopposed tension produced a rapid extension of the tibia (H). Each chart corresponds to the output from a labeled element from Fig. 2.
Fig. 4.
Fig. 4.
Expanded view of jump or kick data. Kick data from Fig. 3 is expanded and compared with data from a jump. The output of the motor program was the same for both the kick and the jump, and so was omitted here. Each chart shows the tension in the extensor and flexor muscle of the left metathoracic leg, the rotation of the femur–tibia (FT) joint and the status of the tendon lock. (A) To produce a kick, the tibia began to rotate very rapidly after the tendon lock was disabled, and completed full extension in 4.1 ms. (B) The jump used the same motor program but the leg rotated more slowly because the tibia was loaded, and so reached its maximum value after 28.35 ms. The colored plot lines have the same colors as the corresponding lines for plots of the same variables in Fig. 3.
Fig. 5.
Fig. 5.
Screenshots of the simulated and real locust jumping. Images of a real locust jump are in the insets. The simulated locust produces a jump very similar to those recorded from live locusts. Live locust images are sequential frames taken using a high-speed camera at 500 frames s−1.
Fig. 6.
Fig. 6.
Jumping performance. (A) Jumps were performed with and without the semi-lunar process (SLP) for a variety of different extensor tension values. Extensor tension was altered by varying the time between FETi spikes between 10 ms and 23 ms at 1 ms intervals. Twenty jumps were performed at each time interval. Jump distance varied linearly with extensor tension for both cases (R2=0.96 with SLP, R2=0.95 without SLP). Without the SLP the jump distance was reduced by 45% at 15 N, and this reduction increased to 55% at 10 N. (B) Jump distance also varied linearly with the jump energy, and matched the predicted jump distance (R2=0.98). This is consistent with the hypothesized relationship between jump energy and distance (Bennet-Clark, 1975).
Fig. 7.
Fig. 7.
Jump power with and without semi-lunar process (SLP). Only extensor tensions within 0.25 N of 15 N were used. Jump power with the SLP intact (black) and with the SLP disabled (gray). There is a significant difference in the magnitude of the peak power (1.94±0.05 mW with, 1.10±0.04 mW without, P<10−30), the total energy during the jump impulse (15.3±0.4 mJ with, 8.58±0.4 mJ without, P<10−30) and the duration of the impulse (24.7±0.3 ms with, 24.1±0.3 ms without, P<10−10).
Fig. 8.
Fig. 8.
Semi-lunar process (SLP) movement and torque during a kick. Prior to the kick, the tibia was flexed, the extensor tension was 15 N, SLP torque was −4.7 mN m−1, and the SLP strain was nearly 4.5 mm. (A) The femur–tibia (FT) joint rotated with a maximum velocity of 63 deg. m s−1 and reached full extension of 160 deg. in 4 ms (broken gray line, right axis). The SLP strain decreased quickly during the kick (black line, left axis). The filled black squares represent the SLP positions at 1 ms time intervals when a high-speed camera at 1000 frames s−1 would take images [compare with fig. 3B of Burrows and Morris (Burrows and Morris, 2001)]. The beginning of the kick is shown with the broken vertical line (i). The first point where a noticeable decrease in the SLP would be visible at 1000 frames s−1 is shown with the broken vertical line (iii), which corresponds to a FT rotation of 38.12 deg. (B) SLP torque around the extensor attachment point (black line, left axis) was initially negative, which helped to maintain leg flexion. Significant SLP movement and leg extension occurred after the torque became positive, at broken vertical line (ii). (C) Negative SLP torque occurred when the force applied by the SLP caused torques that retarded tibia rotation (i), while positive torque enhanced tibia rotation. Positive torque only occurred after the leg had rotated enough to move the extensor attachment point to the opposite side of the SLP force vector (iii). Light gray hinge joint is the position of the FT joint at that time, while the black hinge is the position of the FT joint at the beginning of the kick. Figures in part C are for illustrative purposes only and are not drawn to scale.

Similar articles

Cited by

References

    1. Bennet-Clark H. C. (1975). The energetics of the jump of the locust Schistocerca gregaria. J. Exp. Biol. 63, 53-83 - PubMed
    1. Bennet-Clark H. C., Lucey E. C. (1967). The jump of the flea: a study of the energetics and a model of the mechanism. J. Exp. Biol. 47, 59-67 - PubMed
    1. Burrows M. (1995). Motor patterns during kicking movements in the locust. J. Comp. Physiol. A 176, 289-305 - PubMed
    1. Burrows M. (1996). The Neurobiology of an Insect Brain Oxford: Oxford University Press;
    1. Burrows M. (2003). Biomechanics: froghopper insects leap to new heights. Nature 424, 509 - PubMed

Publication types