

Effects of combination lipid therapy in type 2 diabetes mellitus
- PMID: 20228404
- PMCID: PMC2879499
- DOI: 10.1056/NEJMoa1001282
Effects of combination lipid therapy in type 2 diabetes mellitus
Erratum in
- N Engl J Med. 2010 May 6;362(18):1748
Abstract
Background: We investigated whether combination therapy with a statin plus a fibrate, as compared with statin monotherapy, would reduce the risk of cardiovascular disease in patients with type 2 diabetes mellitus who were at high risk for cardiovascular disease.
Methods: We randomly assigned 5518 patients with type 2 diabetes who were being treated with open-label simvastatin to receive either masked fenofibrate or placebo. The primary outcome was the first occurrence of nonfatal myocardial infarction, nonfatal stroke, or death from cardiovascular causes. The mean follow-up was 4.7 years.
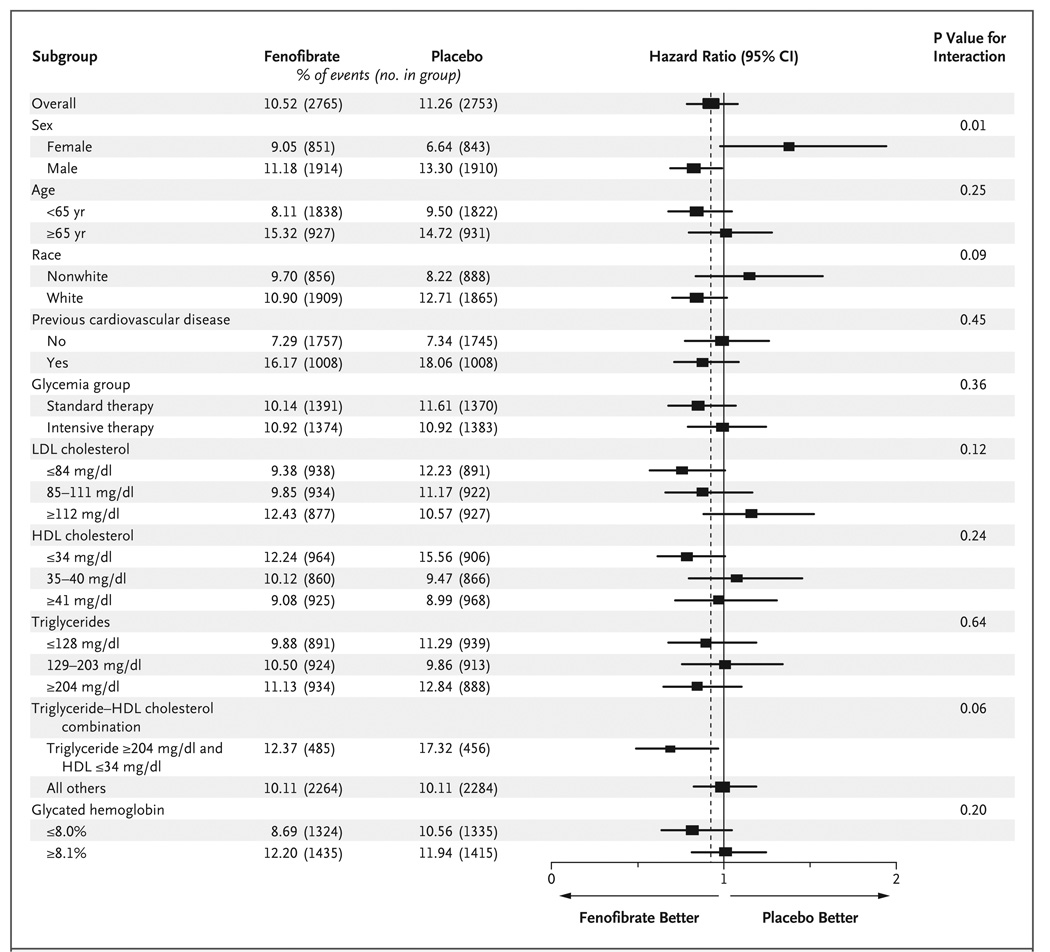
Results: The annual rate of the primary outcome was 2.2% in the fenofibrate group and 2.4% in the placebo group (hazard ratio in the fenofibrate group, 0.92; 95% confidence interval [CI], 0.79 to 1.08; P=0.32). There were also no significant differences between the two study groups with respect to any secondary outcome. Annual rates of death were 1.5% in the fenofibrate group and 1.6% in the placebo group (hazard ratio, 0.91; 95% CI, 0.75 to 1.10; P=0.33). Prespecified subgroup analyses suggested heterogeneity in treatment effect according to sex, with a benefit for men and possible harm for women (P=0.01 for interaction), and a possible interaction according to lipid subgroup, with a possible benefit for patients with both a high baseline triglyceride level and a low baseline level of high-density lipoprotein cholesterol (P=0.057 for interaction).
Conclusions: The combination of fenofibrate and simvastatin did not reduce the rate of fatal cardiovascular events, nonfatal myocardial infarction, or nonfatal stroke, as compared with simvastatin alone. These results do not support the routine use of combination therapy with fenofibrate and simvastatin to reduce cardiovascular risk in the majority of high-risk patients with type 2 diabetes. (ClinicalTrials.gov number, NCT00000620.)
2010 Massachusetts Medical Society
Figures


Comment in
-
ACCORD and Risk-Factor Control in Type 2 Diabetes.N Engl J Med. 2010 Apr 29;362(17):1628-30. doi: 10.1056/NEJMe1002498. Epub 2010 Mar 14. N Engl J Med. 2010. PMID: 20228405 No abstract available.
-
Therapeutics. Fenofibrate plus simvastatin did not prevent major CV events more than simvastatin alone in type 2 diabetes.Ann Intern Med. 2010 Jul 20;153(2):JC1-5. doi: 10.7326/0003-4819-153-2-201007200-02005. Ann Intern Med. 2010. PMID: 20643983 No abstract available.
-
Combination lipid therapy in type 2 diabetes.N Engl J Med. 2010 Aug 12;363(7):692; author reply 694-5. doi: 10.1056/NEJMc1006407. N Engl J Med. 2010. PMID: 20701533 No abstract available.
-
Combination lipid therapy in type 2 diabetes.N Engl J Med. 2010 Aug 12;363(7):692-4; author reply 694-5. doi: 10.1056/NEJMc1006407. N Engl J Med. 2010. PMID: 20842772 No abstract available.
-
Combination lipid therapy in type 2 diabetes.N Engl J Med. 2010 Aug 12;363(7):694; author reply 694-5. doi: 10.1056/NEJMc1006407. N Engl J Med. 2010. PMID: 20842773 No abstract available.
-
PURLs: Add a fibrate to a statin?J Fam Pract. 2010 Oct;59(10):582-4. J Fam Pract. 2010. PMID: 20922178 Free PMC article.
-
Combination lipid therapy in type 2 diabetes.Curr Atheroscler Rep. 2011 Feb;13(1):1-3. doi: 10.1007/s11883-010-0139-y. Curr Atheroscler Rep. 2011. PMID: 21086075 No abstract available.
-
Effects of combination lipid therapy in diabetes mellitus.Curr Atheroscler Rep. 2011 Apr;13(2):104-6. doi: 10.1007/s11883-011-0162-7. Curr Atheroscler Rep. 2011. PMID: 21380940 No abstract available.
-
[Cardiovascular risk in type 2 diabetes. ACCORD study (Action to Control Cardiovascular Risk in Diabetes)].Internist (Berl). 2011 May;52(5):601-4. doi: 10.1007/s00108-011-2843-2. Internist (Berl). 2011. PMID: 21455685 German. No abstract available.
References
-
- Almdal T, Scharling H, Jensen JS, Vestergaard H. The independent effect of type 2 diabetes mellitus on ischemic heart disease, stroke, and death: a population-based study of 13,000 men and women with 20 years of follow-up. Arch Intern Med. 2004;164:1422–1426. - PubMed
-
- Stamler J, Vaccaro O, Neaton JD, Wentworth D. Diabetes, other risk factors, and 12-yr cardiovascular mortality for men screened in the Multiple Risk Factor Intervention Trial. Diabetes Care. 1993;16:434–444. - PubMed
-
- Haffner SM, Lehto S, Rönnemaa T, Pyörälä K, Laakso M. Mortality from coronary heart disease in subjects with type 2 diabetes and in nondiabetic subjects with and without prior myocardial infarction. N Engl J Med. 1998;339:229–234. - PubMed
-
- Miettinen H, Lehto S, Salomaa V, et al. Impact of diabetes on mortality after the first myocardial infarction. Diabetes Care. 1998;21:69–75. - PubMed
-
- Chahil TJ, Ginsberg HN. Diabetic dyslipidemia. Endocrinol Metab Clin North Am. 2006;35:491–510. - PubMed
Publication types
MeSH terms
Substances
Associated data
Grants and funding
- N01 HC095179/HL/NHLBI NIH HHS/United States
- N01 HC095184/HL/NHLBI NIH HHS/United States
- R01 HL055638/HL/NHLBI NIH HHS/United States
- N01-HC-95180/HC/NHLBI NIH HHS/United States
- N01 HC095178/HL/NHLBI NIH HHS/United States
- UL1 RR024156/RR/NCRR NIH HHS/United States
- IAAY1-HC-9035/HC/NHLBI NIH HHS/United States
- IAAY1-HC-1010/HC/NHLBI NIH HHS/United States
- N01 HC095182/HL/NHLBI NIH HHS/United States
- N01-HC-95183/HC/NHLBI NIH HHS/United States
- N01-HC-95178/HC/NHLBI NIH HHS/United States
- N01-HC-95179/HC/NHLBI NIH HHS/United States
- N01-HC-95181/HC/NHLBI NIH HHS/United States
- N01 HC095180/HL/NHLBI NIH HHS/United States
- Y01 HC001010/HC/NHLBI NIH HHS/United States
- Y01 HC009035/HC/NHLBI NIH HHS/United States
- N01 HC095181/HL/NHLBI NIH HHS/United States
- N01-HC-95184/HC/NHLBI NIH HHS/United States
- R01 HL073030/HL/NHLBI NIH HHS/United States
- N01-HC-95182/HC/NHLBI NIH HHS/United States
- N01 HC095183/HL/NHLBI NIH HHS/United States
LinkOut - more resources
Full Text Sources
Other Literature Sources
Medical
Molecular Biology Databases