. 2010 Apr;5(4):280-5.
doi: 10.1038/nnano.2010.29. Epub 2010 Mar 14.

Kinetics of antimicrobial peptide activity measured on individual bacterial cells using high-speed atomic force microscopy

Affiliations

Kinetics of antimicrobial peptide activity measured on individual bacterial cells using high-speed atomic force microscopy

Georg E Fantner et al. Nat Nanotechnol. 2010 Apr.

Abstract

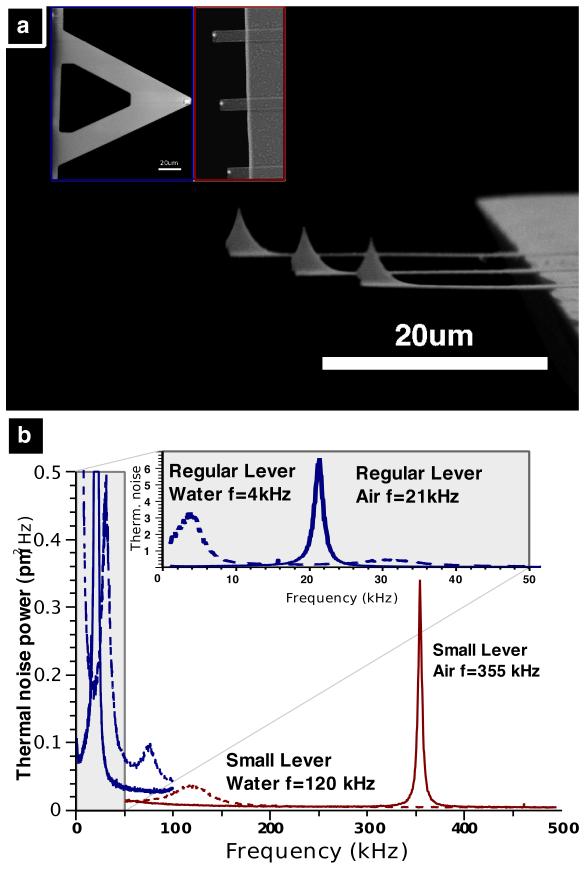
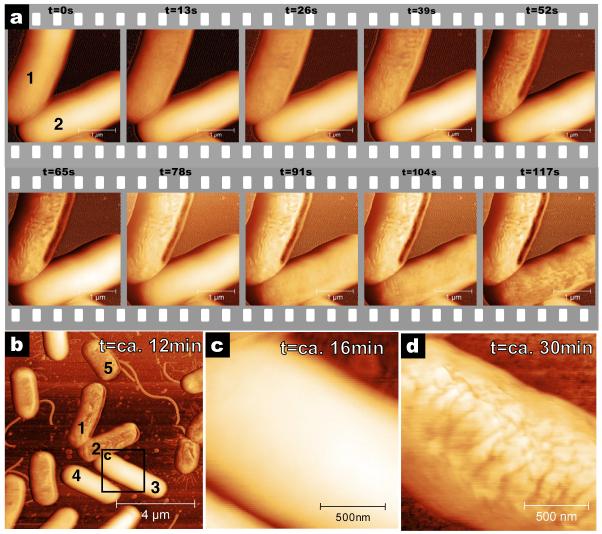
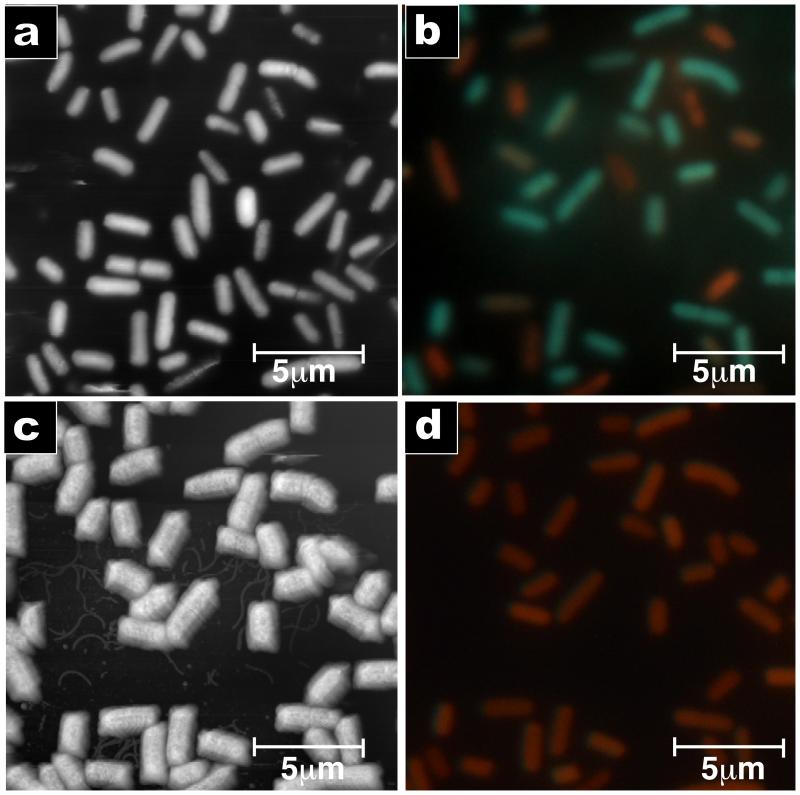
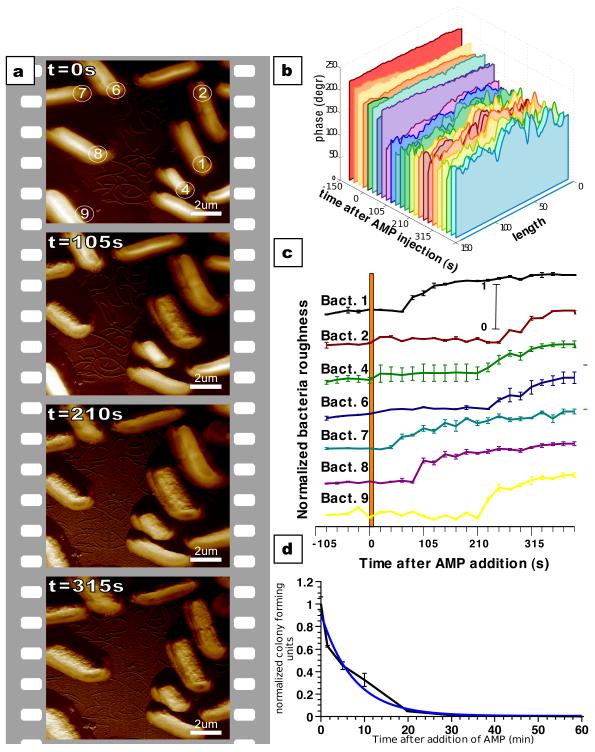
Observations of real-time changes in living cells have contributed much to the field of cellular biology. The ability to image whole, living cells with nanometre resolution on a timescale that is relevant to dynamic cellular processes has so far been elusive. Here, we investigate the kinetics of individual bacterial cell death using a novel high-speed atomic force microscope optimized for imaging live cells in real time. The increased time resolution (13 s per image) allows the characterization of the initial stages of the action of the antimicrobial peptide CM15 on individual Escherichia coli cells with nanometre resolution. Our results indicate that the killing process is a combination of a time-variable incubation phase (which takes seconds to minutes to complete) and a more rapid execution phase.


Figures

Figure 1
Figure 1. Small AFM cantilevers for high-speed AFM
A) SEM image of small SiN cantilevers (~10 μm wide, 100-350 nm thick, 20-30 μm long). The inset image compares the small levers (right) and a conventional lever (left) used for AFM imaging in fluid (Veeco NPS-D) at the same magnification. B) Thermal noise power spectra of regular and small cantilevers. In air (red solid line) the small cantilever’s first resonance frequency is ~350 kHz. In aqueous solution this drops to 100-120 kHz (red dashed line). The insert shows the thermal noise power spectra of an NP-S lever B with resonance frequencies of 21 kHz in air (blue solid line) and 4 kHz in aqueous solution (blue dashed line).
Figure 2
Figure 2. E. coli cell disruption induced by CM15 imaged with high-speed AFM
A) Time series of CM15 antimicrobial action. CM15 injected at t =−6 seconds and images recorded every 13 seconds, with resolution of 1024×256 pixels and rate of 20 lines/s. The upper bacterium’s surface starts changing within 13 seconds. The lower bacterium resists changing for 78 seconds. B) Larger area view recorded 12 minutes after addition of CM15. Most bacteria are corrugated but some are still smooth. C) High-resolution image of bacterium 3 shows that this bacterium is still smooth at t=16 minutes. D) Image of the now corrugated bacterium 3 at t=30 minutes. Eventually, all bacteria in the field of view are affected by CM15. Images were recorded in liquid in tapping mode with a tapping frequency of 110 kHz. Phase images are shown here for high contrast; amplitude data is shown in figure S2. Images B, C and D were recorded with 1024×256 pixels at 2 lines/s.
Figure 3
Figure 3. AmP-induced surface morphology change correlates to cell death
Combined AFM and fluorescence microscopy images recorded on the same spot before and after addition of CM15. A) Tapping mode image of bacteria before addition of CM15 (phase data). The surfaces of most bacteria are smooth. B) Fluorescence image before addition of CM15. Green represents live bacteria; red represents dead bacteria (LIVE/DEAD stain). C) AFM image 30 minutes after exposure to a 2 times the MIC solution of CM15. Nearly all the bacteria exhibit a corrugated surface. D) Fluorescence image after addition of CM15. All bacteria are red, indicating that they are dead. AFM images were taken with 512 × 256 pixels and a scan rate of 0.5 Hz.
Figure 4
Figure 4. Early stage kinetics of CM15 action measured by AFM correlates with bulk killing activity experiment
A) Time series of bacteria after injection of CM15. Images recorded every 21 seconds (1024×256 pixels, 12.2 lines/s) with every 5th image shown (full time series in supplemental material). B) Cross sections along the long axis of bacterium 1 showing the time progression of the surface variation. Each slice represents data extracted from one image in the full time series. C) Averaged surface variation of the bacteria as a function of time after injection of CM15 (bacteria numbers correspond to those in frame one of panel A). D) Bulk measurement of CM15 antimicrobial activity. The interpolated behaviour between 0 and 5 minutes correlates well with the single cell measurements.

Comment in

References

    1. Dufrene YF. Using nanotechniques to explore microbial surfaces. Nat. Rev. Micro. 2004;2:451–460. - PubMed
    1. Dufrene YF. Towards nanomicrobiology using atomic force microscopy. Nat. Rev. Micro. 2008;6:674–680. - PubMed
    1. Matzke R, Jacobson K, Radmacher M. Direct, high-resolution measurement of furrow stiffening during division of adherent cells. Nat. Cell. Biol. 2001;3:607–610. - PubMed
    1. Muller DJ, Baumeister W, Engel A. Controlled unzipping of a bacterial surface layer with atomic force microscopy. Proc. Natl. Acad. Sci.U.S.A. 1999;96:13170–13174. - PMC - PubMed
    1. Muller DJ, Fotiadis D, Scheuring S, Muller SA, Engel A. Electrostatically balanced subnanometer imaging of biological specimens by atomic force microscope. Biophys. J. 1999;76:1101–1111. - PMC - PubMed

Publication types

MeSH terms

Substances