. 2010 Apr;12(4):319-29.
doi: 10.1038/ncb2033. Epub 2010 Mar 14.

Molecular control of kinetochore-microtubule dynamics and chromosome oscillations

Affiliations

Molecular control of kinetochore-microtubule dynamics and chromosome oscillations

Ana C Amaro et al. Nat Cell Biol. 2010 Apr.

Abstract

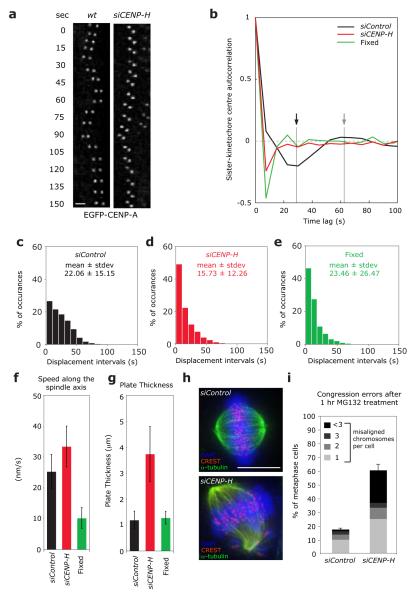
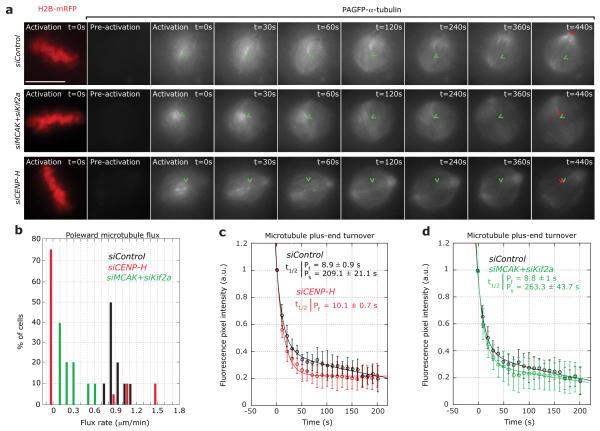
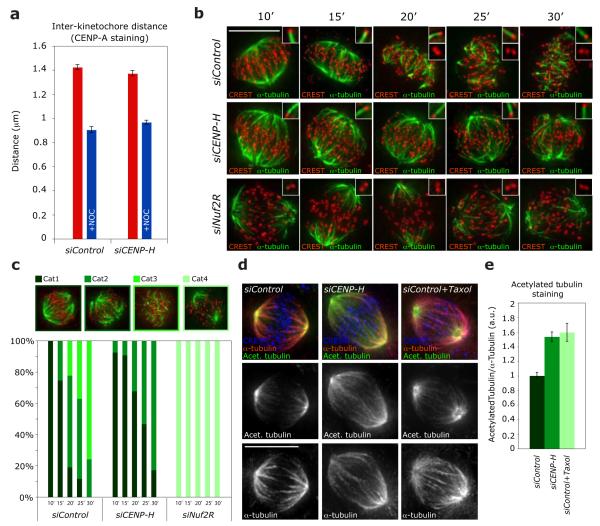
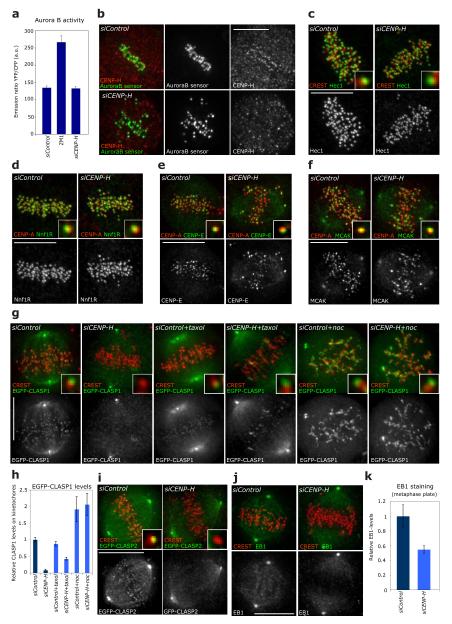
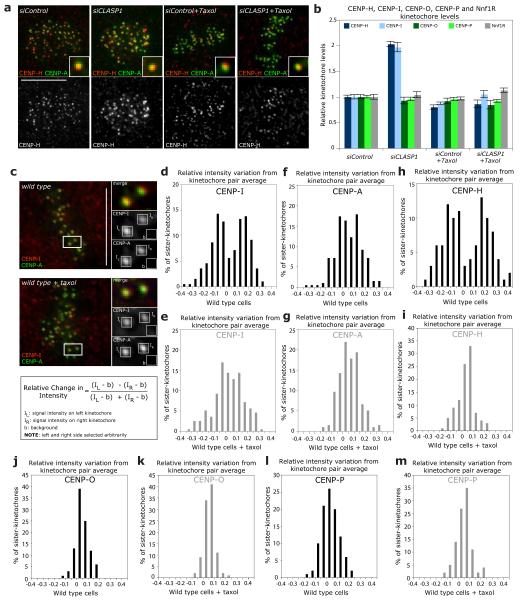
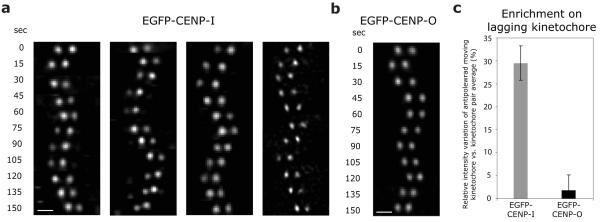
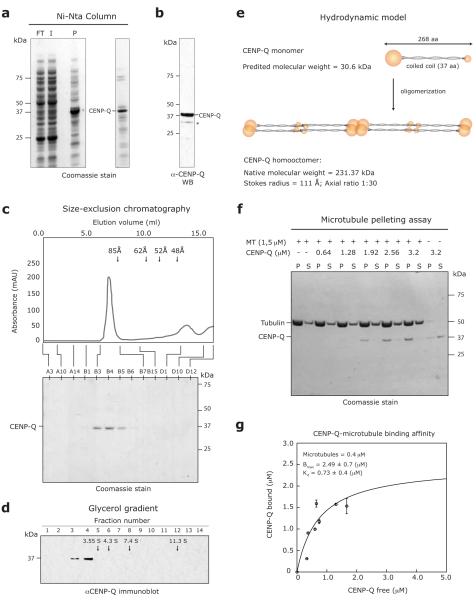
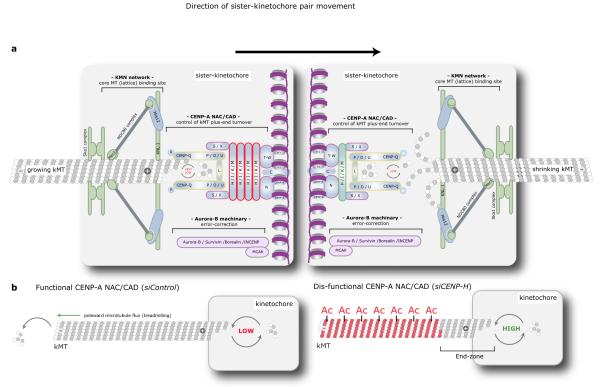
Chromosome segregation in metazoans requires the alignment of sister kinetochores on the metaphase plate. During chromosome alignment, bioriented kinetochores move chromosomes by regulating the plus-end dynamics of the attached microtubules. The bundles of kinetochore-bound microtubules alternate between growth and shrinkage, leading to regular oscillations along the spindle axis. However, the molecular mechanisms that coordinate microtubule plus-end dynamics remain unknown. Here we show that centromere protein (CENP)-H, a subunit of the CENP-A nucleosome-associated and CENP-A distal complexes (CENP-A NAC/CAD), is essential for this coordination, because kinetochores lacking CENP-H establish bioriented attachments but fail to generate regular oscillations, as a result of an uncontrolled rate of microtubule plus-end turnover. These alterations lead to rapid erratic movements that disrupt metaphase plate organization. We also show that the abundance of the CENP-A NAC/CAD subunits CENP-H and CENP-I dynamically change on individual sister kinetochores in vivo, because they preferentially bind the sister kinetochore attached to growing microtubules, and that one other subunit, CENP-Q, binds microtubules in vitro. We therefore propose that CENP-A NAC/CAD is a direct regulator of kinetochore-microtubule dynamics, which physically links centromeric DNA to microtubule plus ends.


Figures

Figure 1
Figure 1
Loss of CENP-H abolishes sister-kinetochore oscillations and disrupts metaphase plate alignment. (a) Live cell stills of single kinetochore pair oscillations in wild-type or CENP-H-depleted EGFP-CENP-A HeLa cells. Scale bar = 2 μm (b) Autocorrelation function of translational sister-kinetochore movements along the spindle axis (kinetochore oscillation) of siControl (black line), siCENP-H (red line) or fixed cells (green line). The autocorrelation function was calculated by combining all aligned sister-kinetochore pairs for each condition (Supplementary Information, Table S2). The first negative lobe in control-depleted cells (black arrow) indicates the half-period of the mean oscillation period, while its depth indicates the oscillation regularity. The second positive lobe (gray arrow) indicates the full period. Note that a random motion always produces a negative value at the first lag (c-e) Histograms of the mean interval time between directional switches of the sister-kinetochore pairs along the spindle axis of siControl (black bars), siCENP-H (red bars) or fixed cells (green bars). For each condition, the mean values and SDs are indicated. (f) Average sister-kinetochore pair speed along the spindle axis of siControl (black bar), siCENP-H (red bar) or fixed cells (green bar). Number of independent experiments n = 3. Error bars represent SD. (g) Width of the metaphase plate of siControl (black bar), siCENP-H (red bar) or fixed cells (green bar). Number of independent experiments n = 3. Error bars represent SD. (h) Representative images of control or CENP-H-depleted cells arrested in metaphase for 1 hour with the proteasome inhibitor MG132 and stained with DAPI (DNA; blue), α-tubulin (MTs; green) and CREST antisera (kinetochores; red). (i) Percentage of cells with one, two, three, or more than three uncongressed chromosomes following a 1 hour treatment with MG132 calculated from images such as shown in (h). Chromosomes in metaphase cells were counted as unaligned if they were located outside the central 30% of the mitotic spindle. Number of independent experiments n = 3 with 20 cells each. Scale bar = 10 μm. Error bars represent SEM.
Figure 2
Figure 2
Loss of CENP-H abrogates MT flux and abolishes control of kMT turnover (a) Successive frames every 30 seconds before and after photoactivation of stable PAGFP-α-tubulin/H2B-mRFP HeLa cells treated with siControl, siCENP-H or siMCAK+siKif2a RNAs. PAGFP-α-tubulin fluorescence was activated in a circular region near the chromosome mass in metaphase cells (detected by the H2B-mRFP signal). A H2B-mRFP (DNA) frame is shown for the first time point of the live-cell movie after activation. (b) Quantification of poleward MT flux rates in cells treated with siControl (black bars), siCENP-H (red bars) or siMCAK+siKif2a (green bars) RNAs. n = 20 cells each (c-e) Quantification of fluorescence intensity decay of the activated regions over time in siControl (black), siCENP-H (red) or siMCAK+siKif2a (green) treated cells. The lines through the data points were fitted to a double exponential equation of the type I = Pf.exp(−kf.t) + Ps.exp(−ks.t), which correspond to previously described slow and fast MT populations, . Analysis of the siCENP-H fluorescence loss indicated that the data fitted to single exponential curve (R = 0.99). Indicated are the corresponding half-lives of the fast and slow MT populations. Green arrowheads mark the initial position of the photoactivated spot and the red arrowheads show the final position of the activated spot. Scale bar = 10 μm. Error bars represent SD.
Figure 3
Figure 3
Loss of CENP-H increases kMT stability. (a) Average inter-kinetochore distances of fixed siControl or siCENP-H transfected EGFP-CENP-A cells treated with or without nocodazole. The quantification was based on the location of CENP-A signals in over 100 cells (>5 kinetochore pairs per cell) from 4 independent experiments without nocodazole and in 10 cells (>5 kinetochore pairs per cell) from 1 experiment with nocodazole. Error bars represent SEM. (b) Representative images of siControl, siCENP-H and siNuf2R transfected cells treated for 10, 15, 20, 25 or 30 min with ice-cold medium and stained with CREST antisera (kinetochores; red) and α-tubulin antibodies (MTs; green). Scale bar = 10 μm (c) Quantification of stable kMTs in cold-treated cells. Bar graph indicates the percentage of cells with all kMTs intact (Cat1), lacking few kMTs (Cat2), few short kMTs left (Cat3) or no kMTs (Cat4). (d) Representative images of cells treated with siControl, siCENP-H or siControl+Taxol RNAs and stained with acetylated-α-tubulin (stable MTs; green), α-tubulin (all MTs; red) and CREST antisera (kinetochores; blue). N = 50 cells Scale bar = 10 μm (e) Immunofluorescence quantification of the ratio of acetylated-α-tubulin to α-tubulin in mitotic spindles of cells after treatment with siControl, siCENP-H or siControl+Taxol from images such as shown in (d). n = 70 cells.
Figure 4
Figure 4
CENP-A NAC/CAD regulates kMT dynamics in an Aurora B/KMN independent manner (a) Graphs showing the Aurora B FRET-based sensor emission ratio of YFP/CFP for mock, ZM1 (Aurora B inhibitor) and siCENP-H-treated cells. An increase in emission ratio indicates dephosphorylation (lower Aurora B activity). Error bars represent SEM based on n = 3 independent experiments. (b) Representative images of siControl or siCENP-H-treated cells fixed after FRET analysis and stained with CENP-H antisera. (c-f) Representative images of siControl or siCENP-H RNA-treated cells stained with CREST or CENP-A (red) and Hec1 (c), Nnf1R (d), CENP-E (e) or MCAK (f) antisera (green). Insets show higher magnification views of a single kinetochore. (g) Representative images of HeLa cells stably expressing EGFP-CLASP1 treated with siControl or siCENP-H RNAs and either no drug, a 1μM taxol or a 1μg/ml nocodazole treatment. Cells were stained with CREST antisera (to mark kinetochores; red). Insets show higher magnification views of a single kinetochore. (h) Quantification of the EGFP-CLASP1 signal on kinetochores normalized with the signal at the spindle poles (see Supplementary Information, Fig. S3 for methodological details for indicated treatments) n > 25 kinetochores for each treatment. Error bars represent SEM based on n = 3 independent experiments. (i) Representative images of HeLa cells transiently expressing EGFP-CLASP2 treated with siControl, siCENP-H and stained with CREST antisera (to mark kinetochores; red). Insets show higher magnification views of a single kinetochore. (j) Representative images of siControl or siCENP-H RNA-treated cells stained with CREST (to mark kinetochores; red) and EB1 antisera (green). (k) Immunofluorescence quantification of EB1 levels on the metaphase plate region after treatment with siControl or siCENP-H RNAs from images such as shown in (j), n = 25 cells Error bars represent SEM based on n = 2 independent experiments. Scale bars = 10 μm.
Figure 5
Figure 5
CENP-H and CENP-I differentially binds to kinetochores attached to growing kinetochore fibres. (a) Representative images of siControl, siCLASP1, siControl+Taxol or siCENP-H+Taxol cells stained with CENP-A antisera (to mark kinetochores; green) and CENP-H antisera (red). Insets show higher magnification views of a single kinetochore. (b) Immunofluorescence quantification of CENP-H, CENP-I, CENP-O, CENP-P and Nnf1R kinetochore levels in cells treated with siControl, siCENP-H, siControl+Taxol or siCENP-H+Taxol RNAs from images such as shown in (a). Error bars represent SEM based on n = 3 independent experiments (c-m) To calculate the asymmetry of the CENP-I (d, e), CENP-A (f, g), CENP-H (h, i), CENP-O (j, k) and CENP-P (I, m) intensities on sister-kinetochore pairs, we determined the intensities of the “left” sister-kinetochore (IL), the “right” sister-kinetochore (IR) and the background value (b) as schematized in (c). If one assumes that x is the average signal intensity of one pair, then the left sister-kinetochore will have an intensity of IL = x + Δ, while the right sister-kinetochore will have an intensity of IR= x - Δ (Δ being the relative positive or negative amount the two sister-kinetochores deviate from the average). By dividing the difference of the background-subtracted intensities over their sum one obtains Δ/x, which indicates by how much the intensity of the left kinetochore is larger or smaller than the average of the two sisters. We then plotted the distribution of Δ/x in cells treated with or without taxol as indicated. A bimodal distribution indicates the existence of two separate sister-kinetochore populations, while a unimodal distribution indicates the absence of protein level asymmetry. Note that CENP-I and CENP-A intensities were measured from the same sister-kinetochores (n = 200 kinetochore pairs for CENP-I and CENP-A; n = 100 kinetochore-pairs for CENP-H, CENP-O and CENP-P). Scale bars = 10 μm.
Figure 6
Figure 6
CENP-I preferentially accumulates on the sister-kinetochore bound to growing MTs (a, b) Representative live cell imaging frames of single oscillating sister-kinetochore pairs of wild type EGFP-CENP-I (x4) or EGFP-CENP-O (x1) cells. (c) Enrichment of EGFP-CENP-I or EGFP-CENP-O on anti-poleward moving sister-kinetochores. The quantifications and calculations were done as in Figure 5c, but in live cells and defining that the “left” kinetochore is the sister-kinetochore that moves in antipoleward manner and is bound to growing MTs. Error bars represent SEM based on n = 4 (EGFP-CENP-I) and n = 3 (EGFP-CENP-O) independent experiments. Scale bars = 2 μm.
Figure 7
Figure 7
The CENP-A NAC/CAD subunit CENP-Q makes direct physical interactions with MTs. (a) SDS-PAGE and coomassie staining of flow-through (FT), input (I), pellet (P) and elution fractions from nickel-NTA chromatography. The band corresponding to CENP-Q is indicated based on mass spectroscopy analysis. (b) Immunoblot of the eluted fraction with anti-CENP-Q antisera. Asterix-marked band corresponds to degradation products of CENP-Q (c) Hydrodynamic analysis of CENP-Q on size exclusion chromatography. Arrows indicate the elution volumes of standards with known Stokes radius: Thyroglobulin (85 Å), Ferritin (62 Å), Catalase (52 Å) and Aldolase (48 Å). (d) Fractions from 5-40% glycerol-gradient analysis of CENP-Q. Arrows indicate the migration of standards with known S values: Catalase (11.3 S), Aldolase (7.4 S), BSA (4.3 S) and Ovalbumin (3.55 S). (e) Model for the predicted organization of CENP-Q based on the biochemical experiments. (f) MT-pelleting assay performed in BRB80 + 50 mM NaCl, 1 mM ADP using 1.5 μM taxol-stabilised pig-brain MTs and purified CENP-Q protein in different concentrations (0.64-3.2 μM) as indicated. Supernatant (S) and pellet (P) fractions are shown. (g) Quantification of CENP-Q:MTs binding affinity. Quantification was performed using 0.4 μM taxol-stabilised pig-brain MTs and purified CENP-Q protein (0.64-3.2 μM). The average of multiple samples were plotted. Error bars indicate SD.
Figure 8
Figure 8
Model for the function of the CENP-A NAC/CAD in controlling kMT dynamics (a) Schematic view of the human kinetochore-MT interface showing the outer KMN and Ska complexes as well as the inner CENP-A NAC/CAD complex. While the Ndc80/Nuf2 and KNL-1 subunits and Ska1/Ska2 subunits are essential for MT attachment, CENP-A NAC/CAD regulates the turnover of kMT plus-ends, by controlling dynamic instability. Importantly, there is a differential stoichiometry of subunits within the CENP-A NAC/CAD complex that is dependent on whether a sister-kinetochore is bound to growing or shrinking MTs. The sister-kinetochore bound to growing microtubules contains high levels of the CENP-H, -I, -K, -M complex (red), whereas the sister-kinetochore bound to shrinking MTs contain low levels of this complex (green). (b) Explanatory model for the lack of correlation between kMT stability and plus-end MT turnover. In control cells, kMT plus-ends exhibit low rates of dynamic instability allowing continual incorporation of new tubulin heterodimers. In contrast, in the absence of the CENP-A NAC/CAD complex, kinetochores still bind and stabilise kMTs through attachments to the MT lattice, but the dynamic instability at the plus-ends is dramatically increased. This results in a high turnover of the MT lattice proximal to the plus-ends (the “end-zone”), due to the elevated frequency of catastrophe and rescue events. Presumably these changes in kMTs dynamics prevent the establishment of regular kinetochore oscillations (see discussion for detail). Moreover, the MT lattice distal to the end-zone becomes hyperstable, causing an interruption of poleward MT flux, as MTs cannot undergo treadmilling any more.

Similar articles

Cited by

References

    1. Cheeseman IM, Chappie JS, Wilson-Kubalek EM, Desai A. The conserved KMN network constitutes the core microtubule-binding site of the kinetochore. Cell. 2006;127:983–997. - PubMed
    1. Tanaka TU, Desai A. Kinetochore-microtubule interactions: the means to the end. Curr Opin Cell Biol. 2008;20:53–63. - PMC - PubMed
    1. Skibbens RV, Skeen VP, Salmon ED. Directional instability of kinetochore motility during chromosome congression and segregation in mitotic newt lung cells: a push-pull mechanism. J Cell Biol. 1993;122:859–875. - PMC - PubMed
    1. Lewis WH. Changes of viscosity and cell activity. Science. 1939;89:400.
    1. Hughes AF, Swann MM. Anaphase movements in the living cell. J. Exp. Biol. 1948;25:45–70.

Publication types

MeSH terms