. 2010 May 20;29(20):2962-72.
doi: 10.1038/onc.2010.67. Epub 2010 Mar 15.

Imatinib resistance associated with BCR-ABL upregulation is dependent on HIF-1alpha-induced metabolic reprograming

Affiliations

Imatinib resistance associated with BCR-ABL upregulation is dependent on HIF-1alpha-induced metabolic reprograming

F Zhao et al. Oncogene. .

Abstract

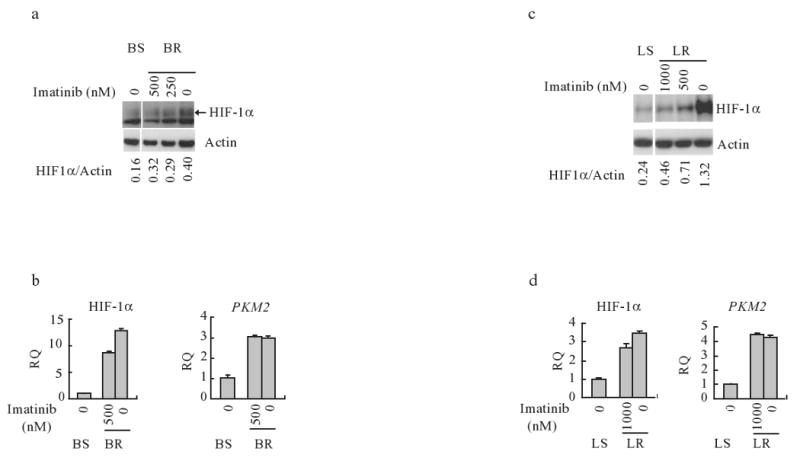
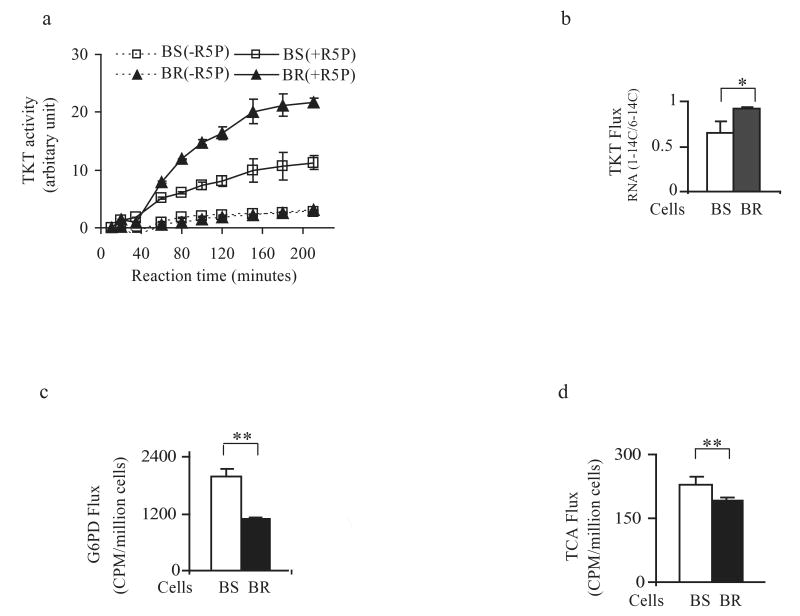
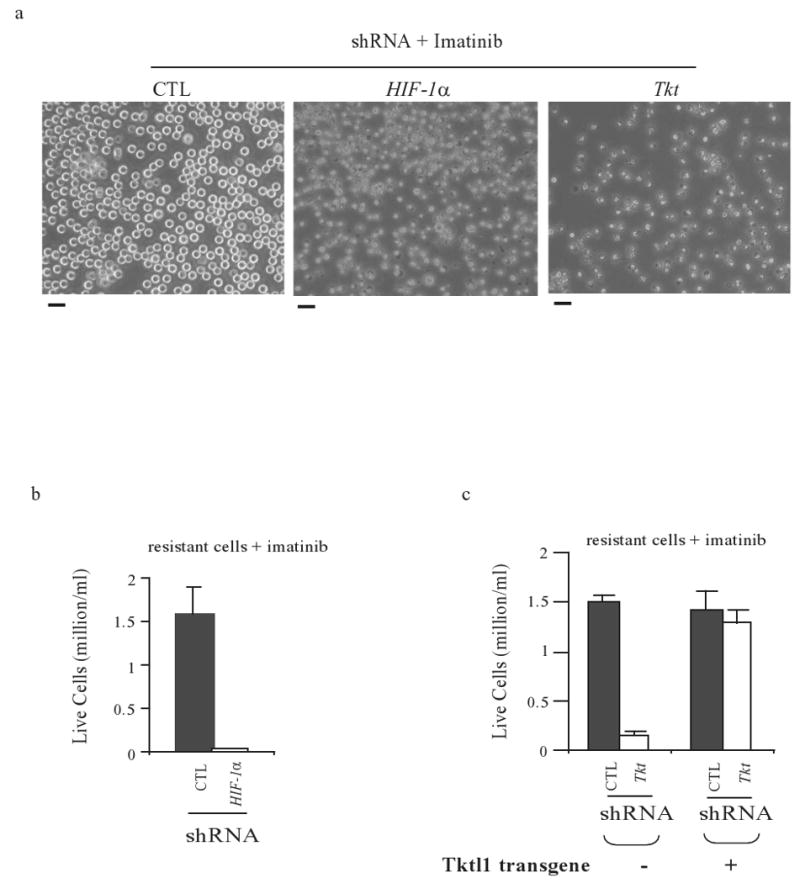
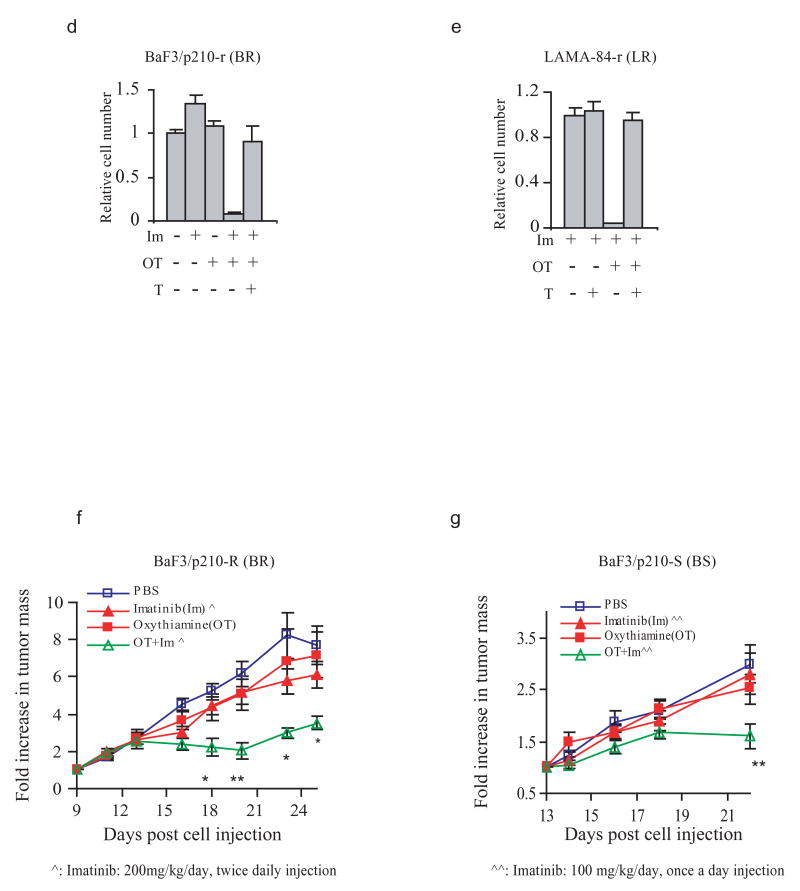
As chronic myeloid leukemia (CML) progresses from the chronic phase to blast crisis, the levels of BCR-ABL increase. In addition, blast-transformed leukemic cells display enhanced resistance to imatinib in the absence of BCR-ABL-resistance mutations. In this study, we show that when BCR-ABL-transformed cell lines were selected for imatinib resistance in vitro, the cells that grew out displayed a higher BCR-ABL expression comparable to the increase seen in accelerated forms of the disease. This enhanced expression of BCR-ABL was associated with an increased rate of glycolysis but with a decreased rate of proliferation. The higher level of BCR-ABL expression in the selected cells correlated with a nonhypoxic induction of hypoxia-inducible factor-1alpha (HIF-1alpha) that was required for cells to tolerate enhanced BCR-ABL signaling. HIF-1alpha induction resulted in an enhanced rate of glycolysis but with reduced glucose flux through both the tricarboxylic acid cycle and the oxidative arm of the pentose phosphate pathway (PPP). The reduction in oxidative PPP-mediated ribose synthesis was compensated by the HIF-1alpha-dependent activation of the nonoxidative PPP enzyme, transketolase, in imatinib-resistant CML cells. In both primary cultures of cells from patients exhibiting blast transformation and in vivo xenograft tumors, use of oxythiamine, which can inhibit both the pyruvate dehydrogenase complex and transketolase, resulted in enhanced imatinib sensitivity of tumor cells. Together, these results suggest that oxythiamine can enhance imatinib efficacy in patients who present an accelerated form of the disease.


Figures

Figure 1
Figure 1. Imatinib-resistant cells display upregulated BCR-ABL protein level, increased glucose uptake, and reduced cell proliferation
(a) to (d), murine imatinib-sensitive (BS) and imatinib-resistant cells (BR). (e) to (h), human imatinib-sensitive (LS) and imatinib-resistant cells (LR). For a to d, equivalent results were also obtained with an independently derived cell line. (a) and (e), Cells were treated with imatinib for 2 days and cell density was determined by trypan blue staining. Relative cell number (mean ± SD) of triplicate samples of a representative experiment is shown. (b) and (f), Western-blot analysis of the BCR-ABL signaling pathway. Cells were treated with imatinib overnight. Thirty μg of total protein lysate was loaded and immunoblotted for indicated proteins. (c) and (g), Glucose uptake. Cells were treated with imatinib overnight and replated at the density of 0.5×10⁶/ml in refreshed medium for 24 hours. Glucose content in medium supernatants was measured. Glucose uptake = (glucose in the medium before the treatment – glucose in the medium after imatinib treatment). Experiment was done in triplicate, and shown is mean glucose uptake (μmol) /106 cells/24 hours (± SD) of a representative experiment. (d) and (h), Cell proliferation. Cells were grown in the absence (-Im) or presence (+Im) of imatinib (Im, 0.5 μM for BR and 1 μM for LR) at a starting concentration of 0.2× 10⁶/ml in triplicate and counted at 0, 24-hour and 48-hour points, respectively. Shown is mean cell concentration (106/ml) ± SD of a representative experiment.
Figure 2
Figure 2. Induction of HIF-1α and its targets in imatinib-resistant cells
Cells were grown in the absence or presence of varying concentrations of imatinib overnight before being harvested for protein or RNA extraction. (a) and (b), murine imatinib-sensitive (BS) and imatinib-resistant cells (BR). (c) and (d), human imatinib-sensitive (LS) and imatinib-resistant cells (LR). The data shown is representative of at least 3 experiments for each cell line. (a) and (c), Western blotting for HIF-1α protein levels. Relative levels of HIF-1α compared to endogenous actin were quantitated and shown below. (b) and (d), Quantitative PCR (qPCR) analysis was used to determine transcript levels. Shown is relative quantity (RQ)±SD.
Figure 3
Figure 3. Imatinib-resistant cells demonstrate a relative increase in glucose flux through the non-oxidative arm of the PPP for ribose synthesis
(a), In vitro transketolase activity. Transketolase activity (TKT activity) was determined as described in Materials and Methods. Shown is TKT activity (arbitrary units) ± SD in the absence (-R5P) or presence (+R5P) of ribose 5-phosphate (R5P). BS, imatinib-sensitive cells; BR, imatinib-resistant cells. (b), 14C-glucose incorporation into RNA. Experiment was performed as described in Materials and Methods. CPM ratio ([1-14C]/ [6-14C]) was defined as relative transketolase flux (TKT flux). Shown is relative TKT flux ±SEM. * indicates p<0.05 as determined by unpaired Student t-test. (c), 14CO2 release from the oxidative arm of the PPP (G6PD flux). The experiment was performed in triplicate. Shown is CPM for G6PD flux (/106 cells) ± SD. ** indicates p<0.01 as determined by unpaired Student t-test. (d), 14CO2 release from the TCA cycle. Experiment was done in triplicate. Shown is CPM for TCA flux (/106 cells) ± SD. ** indicates p<0.01 as determined by unpaired Student t-test. Open bar, imatinib-sensitive cells (BS); black bar, imatinib-resistant cells (BR).
Figure 4
Figure 4. HIF-1α induces glucose flux towards the non-oxidative arm of the PPP for ribose synthesis
a, Hypoxic conditions switch BCR-ABL transformed cells more dependent on non-oxidative PPP for ribose synthesis. Imatinib-sensitive cells (BS and LS) were cultured under hypoxic condition (0.5% O2 level) for two days before cells were replated and 14C-glucose incorporation into RNA was performed as described in Materials and Methods. Shown is relative TKT flux ±SEM. * indicates p<0.05 and ** indicates p<0.01, as determined by unpaired Student t-test. b to e, Experiments were performed in 293T cells stably transfected with a non-degradable HIF-1α construct in an inducible system (Hu et al., 2003). (b), Induction of HIF-1α with 1 μg/ml doxycycline (Dox) for 2 days is shown by Western-blot analysis. The non-specific band under the HIF-1α protein signal is served as a loading control. (c), 14CO2 release through the TCA cycle using [6-14C]-glucose upon HIF-1α induction. Shown is CPM for TCA flux (normalized by glucose uptake) ± SD. ** indicates p<0.05, as determined by unpaired Student t-test. (d), 14CO2 release through G6PD (the oxidative arm of the PPP) using [1-14C]-glucose upon HIF-1α induction. Actual flux through G6PD was corrected by CO2 release from [6-14C]-glucose. Shown is CPM for G6PD flux (normalized by glucose uptake) ± SD. (e), 14C-glucose incorporation into RNA upon HIF-1α induction. Experiment was performed as described in Materials and Methods. Shown is relative TKT flux (RNA [1-14C]/ [6-14C]). f and g, Experiments were performed in IL3-dependent bax (-/-) bak (-/-) cells stably transfected with either a HIF-1α shRNA vector (HIF-1α) or a control vector (vector) (Lum et al., 2007). (f), 14C-glucose incorporation into RNA upon HIF-1α knockdown. Shown is the relative TKT flux. The inhibition of Tkt flux was also observed in an independent cell clone with stable knockdown of HIF-1α (data not shown). (g), qPCR analysis demonstrates the downregulation of transketolase genes in cells expressing a stable shRNA against HIF-1α. Shown is RQ±SD. Tkt, transketolase; Tktl2, transketolase like 2. Tktl1 (transketolase like 1) was undetectable in these cells. * indicates p<0.05 and ** indicates p<0.01, as determined by unpaired Student t-test.
Figure 5
Figure 5. Inhibition of the non-oxidative nucleotide synthesis restores imatinib sensitivity in resistant cells in vitro and in vivo
a-c, BR cells were transfected with constructs containing either control shRNA (CTL), an shRNA against HIF-1α (HIF-1α) (Lum et al., 2007) or an shRNA against Tkt (Tkt) and cultured in the presence of imatinib (0.5 μM) and the selection drug puromycin (2 μg/ml), with a change of medium every 2-3 days. After 10 days of puromycin selection, cells are shown by bright-field microscopy (a) and live cell counts were performed (b and c) from a representative experiment. Scale bars = 20 μm. d, The transketolase inhibitor, oxythiamine, in combination with imatinib suppressed cell proliferation in murine imatinib-resistant BR cells in vitro. Cells were plated at a density of 0.15×10⁶/ml on day 0 and diluted every 2-3 days with fresh medium. Following 7 days of culture, viable cells were counted and shown is the relative cell number compared to untreated cells (± SD) from a representative experiment. Oxythiamine (OT) was added to cultures at 300 μM, imatinib (Im) was added at 0.5 μM and thiamine (T) was added at 50 μM as indicated. e, Oxythiamine in combination with imatinib suppressed cell proliferation in human imatinib-resistant LR cells in vitro. Cells were plated at a density of 0.3×10⁶/ml on day 0 and diluted every 2 days with fresh medium. Following 6 days of culture, viable cells were counted and shown is the relative cell number compared to untreated cells (± SD) from a representative experiment. Oxythiamine (OT) was added to cultures at 1 mM, imatinib (Im) was added at 1 μM and thiamine (T) was added at 150 μM as indicated. f and g, Combination of oxythiamine and imatinib suppresses BCR-ABL expressing tumor growth in vivo. (f), Established tumors derived from imatinib-resistant cells (BR) were treated with PBS (n=5), oxythiamine (80mg/kg/day, once daily) (n=6), imatinib (200mg/kg/day, twice daily) (n=9), or oxythiamine plus imatinib (OT+Im) (n=6) beginning 9 days after tumor initiation with 3×10⁶ cells, with the average tumor size around 100 mm3. Treatment was performed for 17 days by intraperitoneal injection. Shown is the relative increase in tumor mass ± SEM. ** indicates p <0.01 on day 20 and * indicates p<0.05 on days 18, 23, 25 between combination treatment group and any other treatment group, as determined by unpaired Student t-test. Effect of combining oxythiamine and imatinib via oral administration on tumor growth was also evaluated and similar result was obtained (data not shown). (g), Established tumors derived from imatinib-sensitive cells (BS) were treated with PBS (n=4), oxythiamine (80mg/kg/day) (n=6), imatinib (100mg/kg/day) (n=6), or oxythiamine plus imatinib (OT+Im) (n=5) beginning 13 days after tumor initiation with 1.5×10⁶ cells, with the average tumor size around 250 mm3. Treatment was performed once daily for 9 days via oral administration. Shown is the relative increase in tumor mass ± SEM. ** indicates p <0.01 on day 22 between combination treatment group and any other treatment group, as determined by unpaired Student t-test.
Figure 6
Figure 6. Oxythiamine enhances the efficacy of imatinib in primary CML cells isolated from patients in the accelerated/blastic phase of the disease
MNCs from two patients at the accelerated phase of the disease were harvested and plated for the colony formation as described in Materials and Methods, with indicated treatments. Two weeks later, colonies were counted. The experiment was performed in triplicate and shown is the averaged number of colonies from each plate ± SEM. ** indicates p<0.01, *** indicates p<0.001 and **** indicates p<0.0001, as determined by unpaired Student t-test. Oxythiamine (OT), imatinib (Im) and thiamine (T) were added as indicated.

References

    1. Barnes DJ, Palaiologou D, Panousopoulou E, Schultheis B, Yong AS, Wong A, et al. Bcr-Abl expression levels determine the rate of development of resistance to imatinib mesylate in chronic myeloid leukemia. Cancer Res. 2005a;65:8912–9. - PubMed
    1. Barnes K, McIntosh E, Whetton AD, Daley GQ, Bentley J, Baldwin SA. Chronic myeloid leukaemia: an investigation into the role of Bcr-Abl-induced abnormalities in glucose transport regulation. Oncogene. 2005b;24:3257–67. - PubMed
    1. Bell EL, Chandel NS. Mitochondrial oxygen sensing: regulation of hypoxia-inducible factor by mitochondrial generated reactive oxygen species. Essays Biochem. 2007;43:17–27. - PubMed
    1. Carroll M, Ohno-Jones S, Tamura S, Buchdunger E, Zimmermann J, Lydon NB, et al. CGP 57148, a tyrosine kinase inhibitor, inhibits the growth of cells expressing BCR-ABL, TEL-ABL, and TEL-PDGFR fusion proteins. Blood. 1997;90:4947–52. - PubMed
    1. Chamberlain BR, Buttery JE, Pannall PR. A stable reagent mixture for the whole blood transketolase assay. Ann Clin Biochem. 1996;33(Pt 4):352–4. - PubMed

Publication types

MeSH terms

LinkOut - more resources