Effects of IL-3 and SCF on Histamine Production Kinetics and Cell Phenotype in Rat Bone Marrow-derived Mast Cells
- PMID: 20228932
- PMCID: PMC2837153
- DOI: 10.4110/in.2010.10.1.15
Effects of IL-3 and SCF on Histamine Production Kinetics and Cell Phenotype in Rat Bone Marrow-derived Mast Cells
Abstract
Background: Rat mast cells were regarded as a good model for mast cell function in immune response.
Methods: Rat bone marrow mast cells (BMMC) were prepared both by recombinant rat IL-3 (rrIL-3) and by recombinant mouse stem cell factor (rmSCF), and investigated for both proliferation and differentiation in time course. Rat BMMC was induced by culture of rat bone marrow cells (BMCs) in the presence of both rrIL-3 (5 ng/ml) and rmSCF (5 ng/ml). Culture media were changed 2 times per week with the cell number condition of 5x10(4)/ml in 6 well plate. Proliferation was analyzed by cell number and cell counting kit-8 (CCK-8) and differentiation was by rat mast cell protease (RMCP) II and histamine.
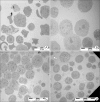
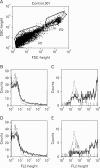
Results: Cell proliferation rates reached a maximum at 8 or 11 days of culture and decreased thereafter. However, both RMCP II production and histamine synthesis peaked after 11 days of culture. By real time RT-PCR, the level of histidine decarboxylase mRNA was more than 500 times higher on culture day 11 than on culture day 5. By transmission electron microscopy, the cells were heterogeneous in size and contained cytoplasmic granules. Using gated flow cytometry, we showed that cultured BMCs expressed high levels of FcepsilonRI and the mast cell antigen, ganglioside, on culture day 11.
Conclusion: These results indicate that rat BMMCs were generated by culturing BMCs in the presence of rrIL-3 and rmSCF and that the BMMCs have the characteristics of mucosal mast cells.
Keywords: Bone marrow; IL-3; Mast cell; Rat; Stem cell factor.
Conflict of interest statement
The authors declare no financial or commercial conflicts of interest.
Figures


 : 50 IM FBS,
  : 50 IM HS,
  : 50 RP HS,
  : 50 RP HS,
  : 70 IM FBS,
  : 70 IM HS,
  : 70 RP FBS,
  : 70 RP HS. In the bar graph, bar with horizontal line, 50% percoll and IMDM; bar with oblique line, 50% percoll and RPMI-1640; bar with vertical line, 70% percoll and IMDM; bar with net cross, 70% percoll and RPMI-1640.
  : 50 IM FBS,
  : 50 IM HS,
  : 50 RP FBS,
  : 50 RP HS,
  : 70 IM FBS,
  : 70 IM HS,
  : 70 RP FBS,
  : 70 RP HS. IM for IMDM, RP for RPMI-1640, NA for not applied, ND for not determined. Y axis for both H and I in log scale.


Similar articles
-
Rat bone marrow-derived mast cells co-cultured with 3T3 fibroblasts in the absence of T-cell derived cytokines require stem cell factor for their survival and maintain their mucosal mast cell-like phenotype.Immunology. 1996 Jul;88(3):375-83. doi: 10.1046/j.1365-2567.1996.d01-664.x. Immunology. 1996. PMID: 8774353 Free PMC article.
-
Stem cell factor enhances immunoglobulin E-dependent mediator release from cultured rat bone marrow-derived mast cells: activation of previously unresponsive cells demonstrated by a novel ELISPOT assay.Immunology. 1996 Feb;87(2):326-33. doi: 10.1046/j.1365-2567.1996.455545.x. Immunology. 1996. PMID: 8698398 Free PMC article.
-
Demonstration of differential effects of cytokines on mast cells derived from murine bone marrow and peripheral blood mononuclear cells.Exp Hematol. 1994 Nov;22(12):1147-55. Exp Hematol. 1994. PMID: 7523167
-
Cytokines regulate development of human mast cells from hematopoietic progenitors.Int J Hematol. 2002 May;75(4):350-6. doi: 10.1007/BF02982123. Int J Hematol. 2002. PMID: 12041663 Review.
-
Ontogeny of in vitro-differentiated mouse mast cells.Fed Proc. 1987 Apr;46(5):1915-9. Fed Proc. 1987. PMID: 3549363 Review.
Cited by
-
Downregulation of iNOS, IL-1β, and P2X7 Expression in Mast Cells via Activation of PAR4 Contributes to the Inhibition of Visceral Hyperalgesia in Rats.J Immunol Res. 2018 May 9;2018:3256908. doi: 10.1155/2018/3256908. eCollection 2018. J Immunol Res. 2018. PMID: 29854833 Free PMC article.
-
Mast cells and basophils are essential for allergies: mechanisms of allergic inflammation and a proposed procedure for diagnosis.Acta Pharmacol Sin. 2013 Oct;34(10):1270-83. doi: 10.1038/aps.2013.88. Epub 2013 Aug 26. Acta Pharmacol Sin. 2013. PMID: 23974516 Free PMC article. Review.
-
In vitro modelling of rat mucosal mast cell function in Trichinella spiralis infection.Parasite Immunol. 2013 Jan;35(1):21-31. doi: 10.1111/pim.12014. Parasite Immunol. 2013. PMID: 23094823 Free PMC article.
-
Short-term in vitro culture of purity and highly functional rat bone marrow-derived mast cells.In Vitro Cell Dev Biol Anim. 2018 Dec;54(10):705-714. doi: 10.1007/s11626-018-0301-3. Epub 2018 Oct 19. In Vitro Cell Dev Biol Anim. 2018. PMID: 30341632
-
Arthritis augments breast cancer metastasis: role of mast cells and SCF/c-Kit signaling.Breast Cancer Res. 2013 Apr 11;15(2):R32. doi: 10.1186/bcr3412. Breast Cancer Res. 2013. PMID: 23577751 Free PMC article.
References
-
- Galli SJ, Nakae S, Tsai M. Mast cells in the development of adaptive immune responses. Nat Immunol. 2005;6:135–142. - PubMed
-
- Marshall JS. Mast-cell responses to pathogens. Nat Rev Immunol. 2004;4:787–799. - PubMed
-
- Bonnefoy JY, Gauchat JF, Life P, Graber P, Mazzei G, Aubry JP. Pairs of surface molecules involved in human IgE regulation: CD23-CD21 and CD40-CD40L. Eur Respir J Suppl. 1996;22:63s–66s. - PubMed
-
- McLachlan JB, Shelburne CP, Hart JP, Pizzo SV, Goyal R, Brooking-Dixon R, Staats HF, Abraham SN. Mast cell activators: a new class of highly effective vaccine adjuvants. Nat Med. 2008;14:536–541. - PubMed
LinkOut - more resources
Full Text Sources

