Review
. 2011 Jan-Feb;3(1):11-32.
doi: 10.1002/wnan.82.

Nanodevices in diagnostics

Affiliations
Review

Nanodevices in diagnostics

Ye Hu et al. Wiley Interdiscip Rev Nanomed Nanobiotechnol. 2011 Jan-Feb.

Abstract

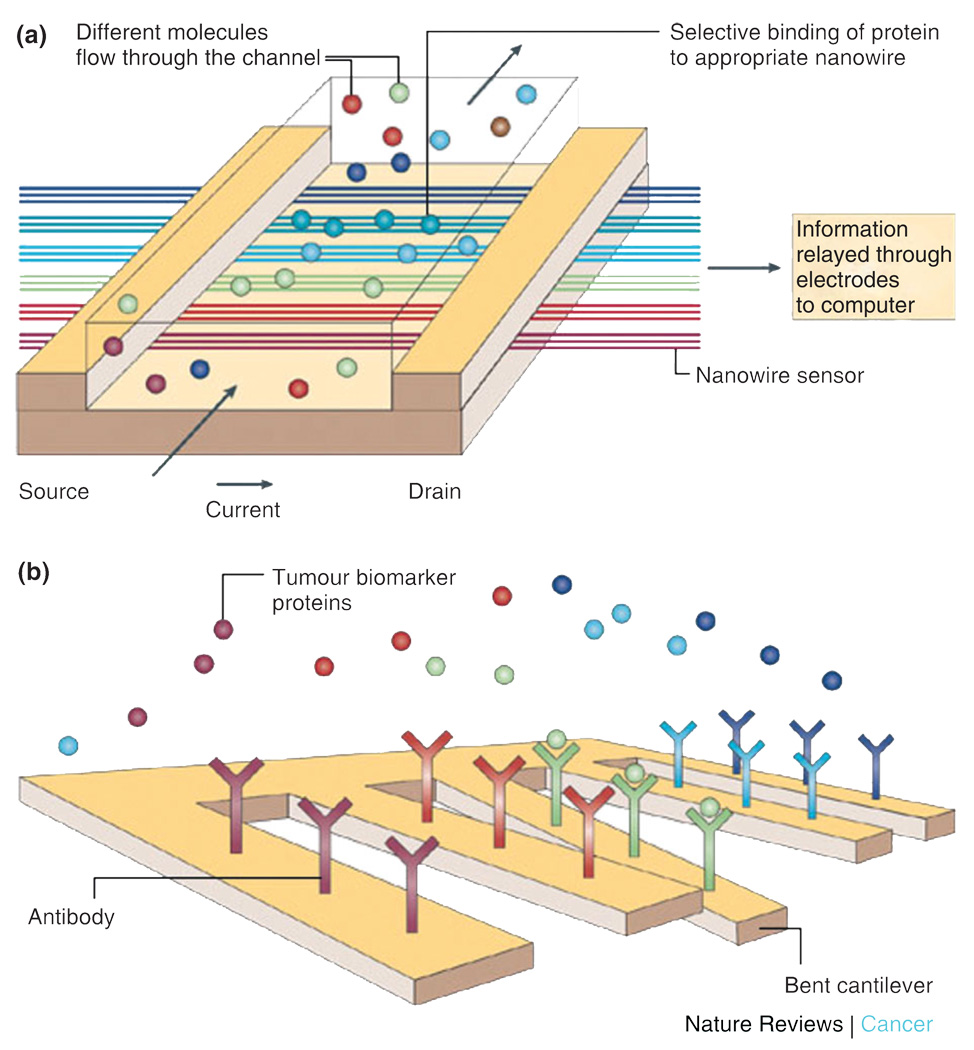
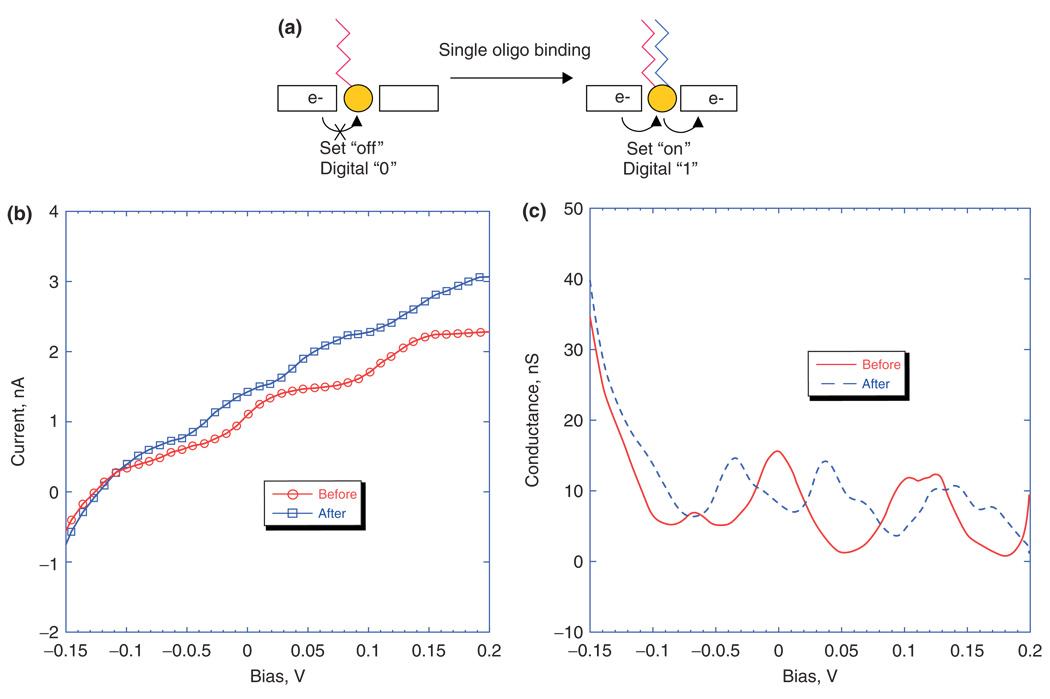
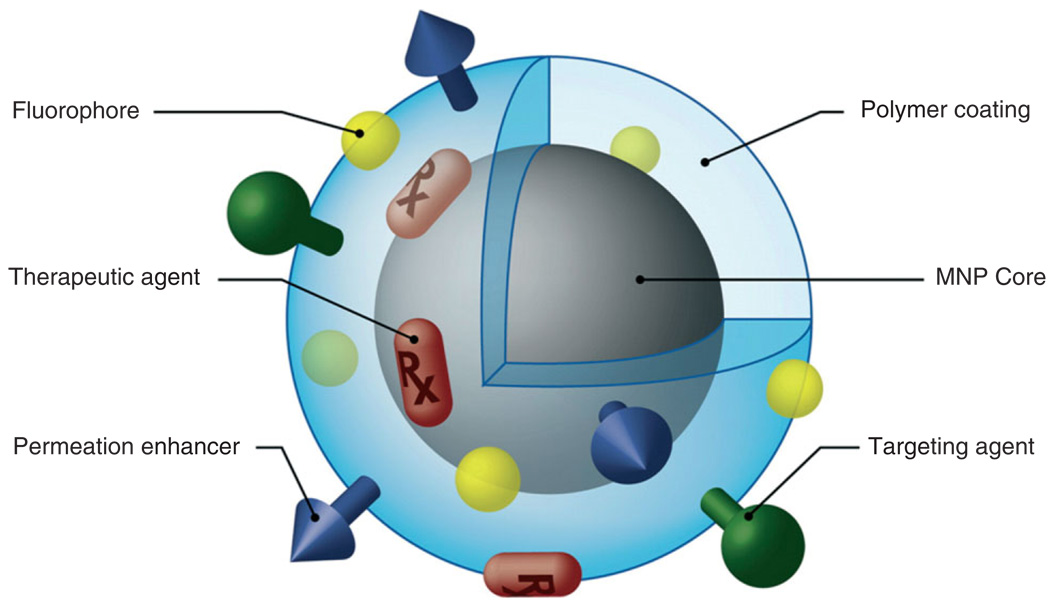
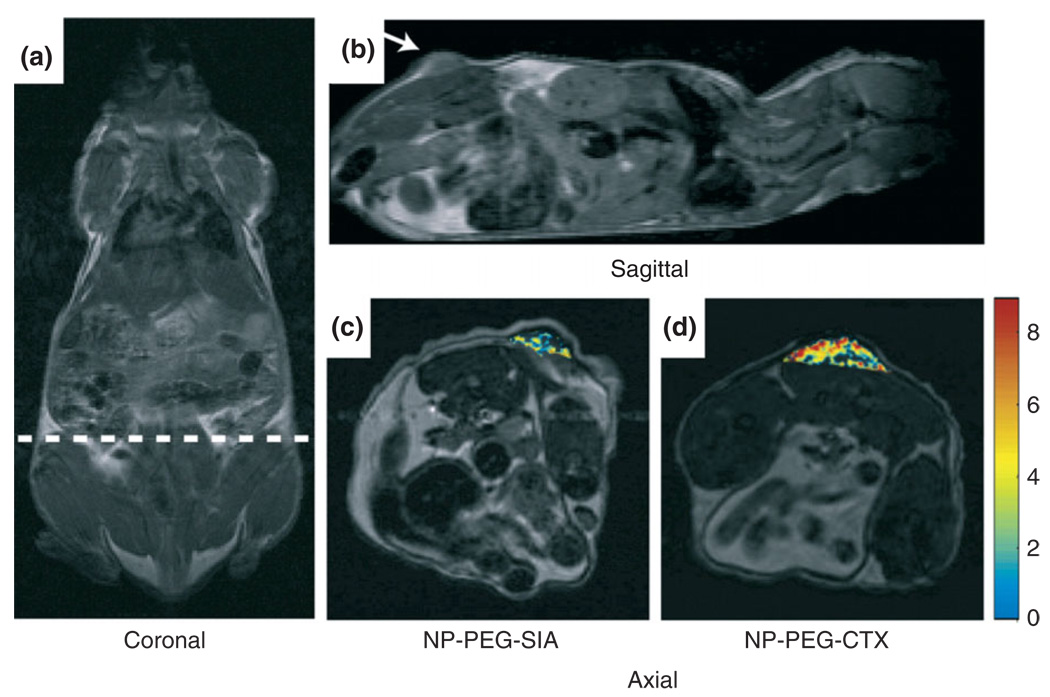
The real-time, personalized and highly sensitive early-stage diagnosis of disease remains an important challenge in modern medicine. With the ability to interact with matter at the nanoscale, the development of nanotechnology architectures and materials could potentially extend subcellular and molecular detection beyond the limits of conventional diagnostic modalities. At the very least, nanotechnology should be able to dramatically accelerate biomarker discovery, as well as facilitate disease monitoring, especially of maladies presenting a high degree of molecular and compositional heterogeneity. This article gives an overview of several of the most promising nanodevices and nanomaterials along with their applications in clinical practice. Significant work to adapt nanoscale materials and devices to clinical applications involving large interdisciplinary collaborations is already underway with the potential for nanotechnology to become an important enabling diagnostic technology.


Figures

FIGURE 1
FIGURE 1
The six hallmarkers of cancer. It has been suggested that most if not all cancers must acquired the common set of functional capabilities depicted here during their development, albeit through a variety of possible mechanistic strategies (reprinted, with permission, from Ref . Copyright 2000 Cell).
FIGURE 2
FIGURE 2
Circulating peptide and protein fragments are shed from all cell types within the tissue microenvironment. Proteolytic cascades within the tissue generate peptide and protein fragments that diffuse into the circulatory system. The identity and cleavage pattern of the peptides provide two important types of diagnostic information (reprinted, with permission, from Ref . Copyright 2006. Nature Reviews Cancer).
FIGURE 3
FIGURE 3
Schematic of the harvesting protocol consisting of (1) the deposition of plasma directly onto the chip surface; (2) the washing away of unbound substances; (3) the extraction of bound molecules; and (4) mass spectrometry analysis (reprinted, with permission, from Ref . Copyright 2006. American Chemical Society).
FIGURE 4
FIGURE 4
MALDI-TOF profiles of human plasma using as matrixes Alpha-cyano-4-hydroxy-cinnamic acid (CHCA) (left panels) and Sinapinic acid (SA) (right panels). (a), (b) Control experiment without chip incubation [direct mass spectrometry (MS) analysis with no pretreatment]; a plasma aliquot was diluted 100-fold with matrix for MS analysis. (c), (d) Control experiment using a solid silica surface (nonporous). (e), (f) Analysis of human plasma proteins after exposure to a nanoporous silica chip. All experiments used 5 µL of human plasma spiked with calcitonin at a concentration of 1 µg/mL. For obtaining spectra (c) and (e), chip surfaces were extracted directly with matrix solution; for spectra (d) and (f), the extract was instead mixed with matrix in a subsequent step (matrix/extract ratio 3:1). The calcitonin peak, only visible in (e), is marked with a star (reprinted, with permission, from Ref . Copyright 2006. American Chemical Society).
FIGURE 5
FIGURE 5
(a) Nanowires deployed within a microfluidic system. The different colors represent that different molecules adsorb or affinity-bind to different nanowire sensors. The binding causes a change in conductance of the wires, which can be electronically and quantitatively detected in real time. The working principle is that of a (biologically gated) transistor and is illustrated in the insert. The charges of the binding protein disrupt electrical conduction in the underlying nanowire. The nanosize of the wire is required to attain high signal-to-noise ratios. (b) Nanocantilever array. The biomarker proteins are affinity-bound to the cantilevers and cause them to deflect. The deflections can be directly observed with lasers. Alternatively, the shift in resonant frequencies caused by the binding can be electronically detected. As for nanowire sensors, the breakthrough potential in nanocantilever technology is the ability to sense a large number of different proteins at the same time, in real time (reprinted, with permission, from Ref . Copyright 2005. Nature Reviews Cancer).
FIGURE 6
FIGURE 6
(a) Illustration of the concept of ‘digital detection’ of oligonucleotide hybridization, and plots of I/V (b) and G/V (c) for positive binding of complementary oligo target to probe. For positive binding, ΔV decreases by approximately half (reprinted, with permission, from Ref . Copyright 2006. American Chemical Society).
FIGURE 7
FIGURE 7
Magnetic nanoparticle possessing various ligands to enable multifunctionality from a single nanoparticle platform (reprinted, with permission, from Ref . Copyright 2008. Elsevier B.V.).
FIGURE 8
FIGURE 8
Magnetic resonance imaging (MRI) anatomical image of a mouse in (a). Coronal plane with the dotted line displaying the approximate location of the axial cross-sections displayed in (c) and (d). Anatomical image in (b). Sagittal plane displaying the location of the 9L xenograft tumor. Change in R2 relaxation values for the tumor regions (superimposed over anatomical MR images) for mouse receiving (c) non-targeting PEG-coated iron oxide nanoparticles and (d) CTX-targeted PEG-coated iron oxide nanoparticles 3 h post nanoparticle injection (reprinted, with permission, from Ref . Copyright 2008. Wiley-VCH Verlag GmbH & Co.).
FIGURE 9
FIGURE 9
Sensitivity and multicolor capability of quantum dot (QD) imaging in live animals. (a) Sensitivity and spectral comparison between QD-tagged and green fluorescent protein (GFP)-transfected cancer cells and (b) simultaneous in vivo imaging of multicolor QD-encoded microbeads. The right-hand images in (a) show QD-tagged cancer cells (orange, upper) and GFP-labeled cells (green, lower). Approximately 1000 of the QD-labeled cells were injected on the right flank of a mouse, whereas the same number of GFP-labeled cells was injected on the left flank (circle) of the same animal. Similarly, the right-hand images in (b) show QD-encoded microbeads (0.5 m diameter) emitting green, yellow, or red light. Approximately 1–2 million beads in each color were injected subcutaneously at three adjacent locations on a host animal. In both (a) and (b), cell and animal imaging data were acquired with tungsten or mercury lamp excitation, a filter set designed for GFP fluorescence and true color digital cameras. Transfected cancer cell lines for high level expression of GFP were developed using retroviral vectors, but the exact copy numbers of GFP per cell have not been determined quantitatively (reprinted, with permission, from Ref . Copyright 2006. Nature Biotechnology).
FIGURE 10
FIGURE 10
(a) Light-scattering images of normal and cancer cells without nanoparticles. (b) Light-scattering images of normal and cancer cells after incubation with anti-endothelial growth factor receptor (EGFR) antibody-conjugated gold nanospheres. (c) Light-scattering images of normal and cancer cells after incubation with anti-EGFR antibody-conjugated gold nanorods. HOC, human osteocalcin; HSC, hematopoietic stem cells (reprinted, with permission, from Ref . Copyright 2006. American Chemical Society).
FIGURE 11
FIGURE 11
Amplified detection of thrombin on surfaces by the catalytic enlargement of thrombin aptamer-functionalized Au nanoparticles (reprinted, with permission, from Ref . Copyright 2006. American Chemical Society).
FIGURE 12
FIGURE 12
Bio-barcode assay. (a) Probe design and preparation. (b) A magnetic probe captures a target using either monoclonal antibody or complementary oligonucleotide. Target-specific gold nanoparticles sandwich the target and account for target identification and amplification. The barcode oligonucleotides are released and detected using the scanometric method (reprinted, with permission, from Ref . Copyright 2006. Science).
FIGURE 13
FIGURE 13
Dendrimer scaffolding dimensions (a) for presenting magnetic resonance imaging (MRI) imaging (b). (a) Scaled spheroids illustrating the relative sizes (nm) for G = 1–8 PAMAM dendrimer series, wherein the (core: 1,2-diaminoethane; G = 1–8); [dendri-PAMAM(NH2)NcNbG] generational series is categorized into the observed periodic properties of (1) flexible scaffolding (G = 1–3), (2) nanocontainer properties (G = 4–6), and (3) rigid surface scaffolding (G = 7 and greater), because of enhanced surface congestion as a function of generation. Note: reversible entry and departure of most guest molecules are possible for G = 4–6; however, the surface is too congested for entry into G = 7 and greater. (b) MRI images of mice using Magnevist®-modified PAMAM dendrimers, i.e. (core: 1,2-diaminoethane; G = 1–8); [dendri-PAMAM(NH2)NcNb G]; wherein, Magnevist® and G = 3–4 are excreted completely through the kidney, G = 5 is excreted through both kidney and liver, and G = 6–9 are excreted exclusively through the liver. Note: G = 3–9 are excellent ‘blood pool’ agents relative to Magnevist® (i.e. diethylenetriaminepenta-acetic acid) and G = 9 is very organ-specific for the liver, presumably because of its large nanosize (reprinted, with permission, from Ref . Copyright 2007. Biochemical Society Transactions).

References

    1. Bouck N, Stellmach V, Hsu SC. How tumors become angiogenic. Adv Cancer Res. 1996;69:135–174. - PubMed
    1. DeBerardinis RJ, Lum JJ, Hatzivassiliou G, Thompson CB. The biology of cancer: metabolic reprogramming fuels cell growth and proliferation. Cell Metabolism. 2008;7:11–20. - PubMed
    1. Cheng MMC, Cuda G, Bunimovich YL, Gaspari M, Heath JR, et al. Nanotechnologies for biomolecular detection and medical diagnostics. Curr Opin Chem Biol. 2006;10:11–19. - PubMed
    1. Jemal A, Siegel R, Ward E, Hao Y, Xu J, et al. Cancer statistics, 2008. CA Cancer J Clin. 2008;58:71–96. - PubMed
    1. Tabár L, Fagerberg CJ, Gad A, Baldetorp L, Holmberg LH, et al. Reduction in mortality from breast cancer after mass screening with mammography. Lancet. 1985;1:829–832. - PubMed

FURTHER READING

    1. Riehemann K, Schneider SW, Luger TA, Godin B, Ferrari M, Fuchs H. Nanomedicine—challenge and perspectives. Angew Chem Int Ed Engl. 2009;48:872–897. - PMC - PubMed

LinkOut - more resources