

Automated segmentation and quantification of liver and spleen from CT images using normalized probabilistic atlases and enhancement estimation
- PMID: 20229887
- PMCID: PMC2826383
- DOI: 10.1118/1.3284530
Automated segmentation and quantification of liver and spleen from CT images using normalized probabilistic atlases and enhancement estimation
Abstract
Purpose: To investigate the potential of the normalized probabilistic atlases and computer-aided medical image analysis to automatically segment and quantify livers and spleens for extracting imaging biomarkers (volume and height).
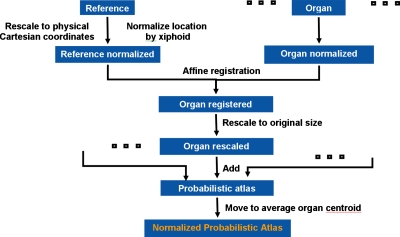
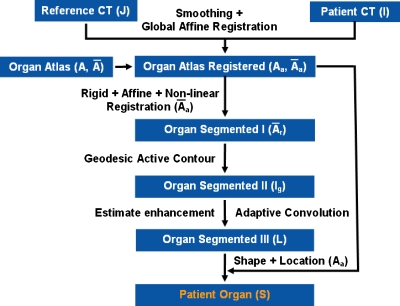
Methods: A clinical tool was developed to segment livers and spleen from 257 abdominal contrast-enhanced CT studies. There were 51 normal livers, 44 normal spleens, 128 splenomegaly, 59 hepatomegaly, and 23 partial hepatectomy cases. 20 more contrast-enhanced CT scans from a public site with manual segmentations of mainly pathological livers were used to test the method. Data were acquired on a variety of scanners from different manufacturers and at varying resolution. Probabilistic atlases of livers and spleens were created using manually segmented data from ten noncontrast CT scans (five male and five female). The organ locations were modeled in the physical space and normalized to the position of an anatomical landmark, the xiphoid. The construction and exploitation of liver and spleen atlases enabled the automated quantifications of liver/spleen volumes and heights (midhepatic liver height and cephalocaudal spleen height) from abdominal CT data. The quantification was improved incrementally by a geodesic active contour, patient specific contrast-enhancement characteristics passed to an adaptive convolution, and correction for shape and location errors.
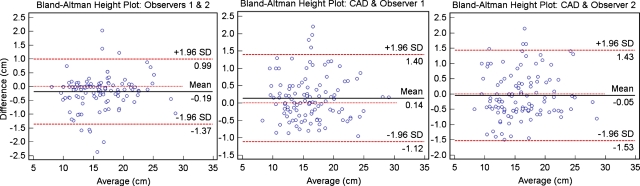
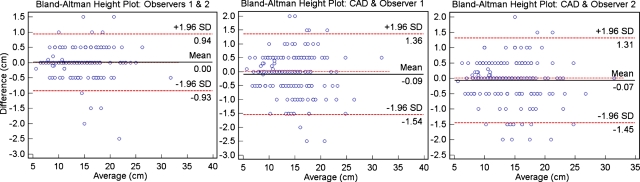
Results: The livers and spleens were robustly segmented from normal and pathological cases. For the liver, the Dice/Tanimoto volume overlaps were 96.2%/92.7%, the volume/height errors were 2.2%/2.8%, the root-mean-squared error (RMSE) was 2.3 mm, and the average surface distance (ASD) was 1.2 mm. The spleen quantification led to 95.2%/91% Dice/Tanimoto overlaps, 3.3%/ 1.7% volume/height errors, 1.1 mm RMSE, and 0.7 ASD. The correlations (R2) with clinical/manual height measurements were 0.97 and 0.93 for the spleen and liver, respectively (p < 0.0001). No significant difference (p > 0.2) was found comparing interobserver and automatic-manual volume/height errors for liver and spleen.
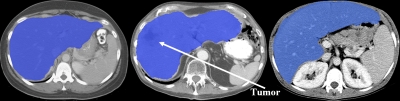
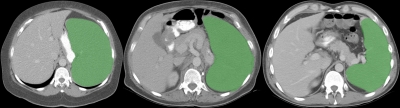
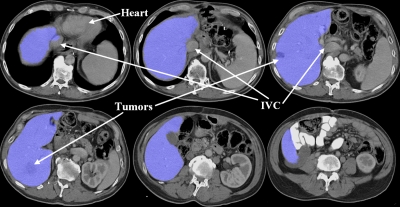
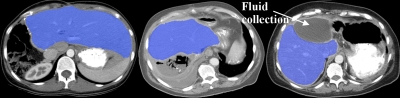
Conclusions: The algorithm is robust to segmenting normal and enlarged spleens and livers, and in the presence of tumors and large morphological changes due to partial hepatectomy. Imaging biomarkers of the liver and spleen from automated computer-assisted tools have the potential to assist the diagnosis of abdominal disorders from routine analysis of clinical data and guide clinical management.
Figures
Similar articles
-
Atlas-based automated segmentation of spleen and liver using adaptive enhancement estimation.Med Image Comput Comput Assist Interv. 2009;12(Pt 2):1001-8. Med Image Comput Comput Assist Interv. 2009. PMID: 20426209
-
Segmentation of liver and spleen based on computational anatomy models.Comput Biol Med. 2015 Dec 1;67:146-60. doi: 10.1016/j.compbiomed.2015.10.007. Epub 2015 Oct 28. Comput Biol Med. 2015. PMID: 26551453
-
Automated segmentation of the injured spleen.Int J Comput Assist Radiol Surg. 2016 Mar;11(3):351-68. doi: 10.1007/s11548-015-1288-9. Epub 2015 Sep 4. Int J Comput Assist Radiol Surg. 2016. PMID: 26337443
-
Automatic extraction of local axis of bone symmetry in CT images.Annu Int Conf IEEE Eng Med Biol Soc. 2008;2008:478-81. doi: 10.1109/IEMBS.2008.4649194. Annu Int Conf IEEE Eng Med Biol Soc. 2008. PMID: 19162697 Review.
-
Automated delineation of radiotherapy volumes: are we going in the right direction?Br J Radiol. 2013 Jan;86(1021):20110718. doi: 10.1259/bjr.20110718. Br J Radiol. 2013. PMID: 23239689 Free PMC article. Review.
Cited by
-
Validation and estimation of spleen volume via computer-assisted segmentation on clinically acquired CT scans.J Med Imaging (Bellingham). 2021 Jan;8(1):014004. doi: 10.1117/1.JMI.8.1.014004. Epub 2021 Feb 19. J Med Imaging (Bellingham). 2021. PMID: 33634205 Free PMC article.
-
Mesenteric vasculature-guided small bowel segmentation on 3-D CT.IEEE Trans Med Imaging. 2013 Nov;32(11):2006-21. doi: 10.1109/TMI.2013.2271487. Epub 2013 Jun 27. IEEE Trans Med Imaging. 2013. PMID: 23807437 Free PMC article.
-
Tumor sensitive matching flow: A variational method to detecting and segmenting perihepatic and perisplenic ovarian cancer metastases on contrast-enhanced abdominal CT.Med Image Anal. 2014 Jul;18(5):725-39. doi: 10.1016/j.media.2014.04.001. Epub 2014 Apr 18. Med Image Anal. 2014. PMID: 24835180 Free PMC article.
-
Automatic Liver Segmentation on Volumetric CT Images Using Supervoxel-Based Graph Cuts.Comput Math Methods Med. 2016;2016:9093721. doi: 10.1155/2016/9093721. Epub 2016 Apr 5. Comput Math Methods Med. 2016. PMID: 27127536 Free PMC article.
-
Multi-Atlas Spleen Segmentation on CT Using Adaptive Context Learning.Proc SPIE Int Soc Opt Eng. 2017 Feb 11;10133:1013309. doi: 10.1117/12.2254437. Epub 2017 Feb 24. Proc SPIE Int Soc Opt Eng. 2017. PMID: 28736468 Free PMC article.
References
-
- Okamoto E. et al., “Prediction of the safe limits of hepatectomy by combined volumetric and functional measurements in patients with impaired hepatic function,” Surgery (St. Louis) SURGAZ 95(5), 586–592 (1984). - PubMed
-
- Zoli M. et al., “Prognostic indicators in compensated cirrhosis,” Am. J. Gastroenterol. AJGAAR 86(10), 1508–1513 (1991). - PubMed
-
- Soyer P. et al., “Hepatic metastases from colorectal cancer: Influence of hepatic volumetric analysis on surgical decision making,” Radiology RADLAX 184(3), 695–697 (1992). - PubMed
Publication types
MeSH terms
Grants and funding
LinkOut - more resources
Full Text Sources
Other Literature Sources
Medical
