

Time-efficient patient-specific quantification of regional carotid artery fluid dynamics and spatial correlation with plaque burden
- PMID: 20229888
- PMCID: PMC2826384
- DOI: 10.1118/1.3292631
Time-efficient patient-specific quantification of regional carotid artery fluid dynamics and spatial correlation with plaque burden
Abstract
Purpose: Low wall shear stress (WSS) and high oscillatory shear index (OSI) influence plaque formation, yet little is known about their role in progression/regression of established plaques because of lack of practical means to calculate them in individual patients. Our aim was to use computational fluid dynamics (CFD) models of patients with carotid plaque undergoing statin treatment to calculate WSS and OSI in a time-efficient manner, and determine their relationship to plaque thickness (PT), plaque composition (PC), and regression.
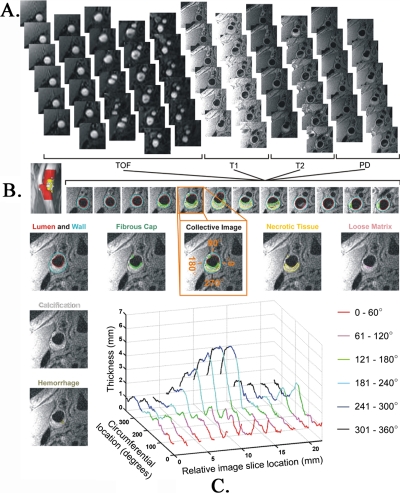
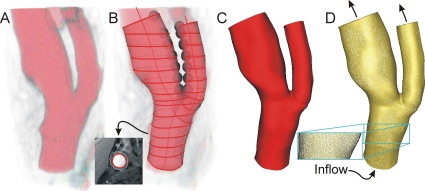
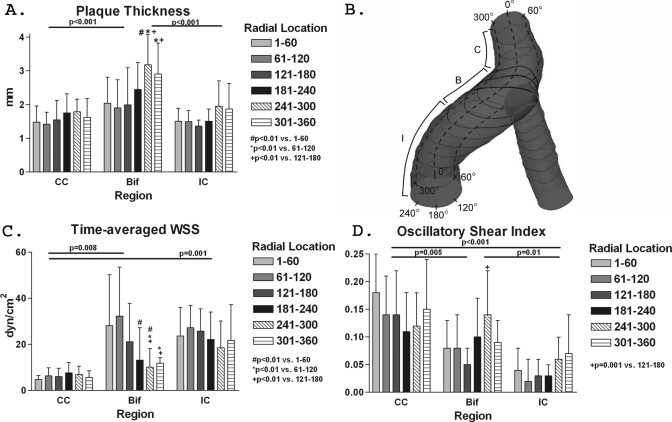
Methods: Eight patients (68 +/- 9 yr, one female) underwent multicontrast 3 T MRI at baseline and six-month post statin treatment. PT and PC were measured in carotid segments (common-CC, bifurcation-B, internal-IC) and circumferentially in nonoverlapping 600 angles and correlated with CFD models created from MRI, ultrasound, and blood pressure.
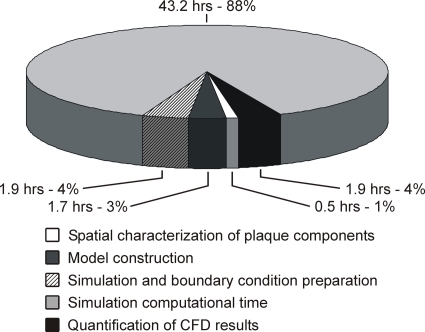
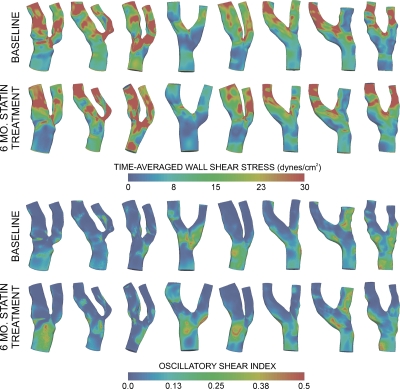
Results: PT was highest in B (2.42 +/- 0.98 versus CC: 1.60 +/- 0.47, IC: 1.62 +/- 0.52 mm, p < 0.01). Circumferentially, plaque was greatest opposite the flow divider (p < 0.01), where the lowest WSS and highest OSI were observed. In B and IC, PT was inversely related to WSS (R = -0.28 and -0.37, p < 0.01) and directly related to OSI (R = 0.22 and 0.52, p < 0.05). The total plaque volume changed from 1140 +/- 437 to 974 +/- 587 mm3 at six months (p = 0.1). Baseline WSS, but not OSI, correlated with changes in PT, necrotic tissue, and hemorrhage in B and IC, but not CC. CFD modeling took 49 +/- 18 h per patient.
Conclusions: PT and PC correspond to adverse WSS and OSI in B and IC, and WSS is modestly but significantly related to changes in PT after short-term statin treatment. Regional hemodynamics from CFD can feasibly augment routine clinical imaging for comprehensive plaque evaluation.
Figures
Similar articles
-
Hemodynamics and wall mechanics in human carotid bifurcation and its consequences for atherogenesis: investigation of inter-individual variation.Biomech Model Mechanobiol. 2004 Sep;3(1):17-32. doi: 10.1007/s10237-004-0046-7. Biomech Model Mechanobiol. 2004. PMID: 15300454
-
Closure technique after carotid endarterectomy influences local hemodynamics.J Vasc Surg. 2014 Aug;60(2):418-27. doi: 10.1016/j.jvs.2014.01.069. Epub 2014 Mar 20. J Vasc Surg. 2014. PMID: 24657293
-
Carotid geometry effects on blood flow and on risk for vascular disease.J Biomech. 2008;41(1):11-9. doi: 10.1016/j.jbiomech.2007.08.012. Epub 2007 Oct 4. J Biomech. 2008. PMID: 17919645
-
MRI-based biomechanical parameters for carotid artery plaque vulnerability assessment.Thromb Haemost. 2016 Mar;115(3):493-500. doi: 10.1160/TH15-09-0712. Epub 2016 Jan 21. Thromb Haemost. 2016. PMID: 26791734 Review.
-
Wall shear stress and its role in atherosclerosis.Front Cardiovasc Med. 2023 Apr 3;10:1083547. doi: 10.3389/fcvm.2023.1083547. eCollection 2023. Front Cardiovasc Med. 2023. PMID: 37077735 Free PMC article. Review.
Cited by
-
Immersive visualization for enhanced computational fluid dynamics analysis.J Biomech Eng. 2015 Mar;137(3):0310041-03100412. doi: 10.1115/1.4029017. Epub 2015 Jan 29. J Biomech Eng. 2015. PMID: 25378201 Free PMC article.
-
The Correlation Between Wall Shear Stress and Plaque Composition in Advanced Human Carotid Atherosclerosis.Front Bioeng Biotechnol. 2022 Jan 28;9:828577. doi: 10.3389/fbioe.2021.828577. eCollection 2021. Front Bioeng Biotechnol. 2022. PMID: 35155418 Free PMC article.
-
Quantitative evaluation using carotid ultrasonography-based high-frame-rate vector flow imaging in patients with low carotid stenosis.Br J Radiol. 2024 Aug 1;97(1160):1476-1482. doi: 10.1093/bjr/tqae115. Br J Radiol. 2024. PMID: 38885374 Free PMC article.
-
A Pilot Study Characterizing Flow Patterns in the Thoracic Aorta of Patients With Connective Tissue Disease: Comparison to Age- and Gender-Matched Controls via Fluid Structure Interaction.Front Pediatr. 2022 May 4;10:772142. doi: 10.3389/fped.2022.772142. eCollection 2022. Front Pediatr. 2022. PMID: 35601426 Free PMC article.
-
Hemodynamic effects of stenosis with varying severity in different segments of the carotid artery using computational fluid dynamics.Sci Rep. 2025 Feb 10;15(1):4896. doi: 10.1038/s41598-025-89100-2. Sci Rep. 2025. PMID: 39929978 Free PMC article.
References
-
- Zarins C. K., Giddens D. P., Haradvaj B. K. B., Sottiurai V. S., Mabon R. F., and Glagov S., “Carotid bifurcation atherosclerosis. Quantitative correlation of plaque localization with flow velocity profiles and wall shear stress,” Circ. Res. CIRUAL 53, 502–514 (1983). - PubMed
-
- Holme P. A., Orvim U., Hamers M. J., Solum N. O., Brosstad F. R., Barstad R. M., and Sakariassen K. S., “Shear-induced platelet activation and platelet microparticle formation at blood flow conditions as in arteries with a severe stenosis,” Arterioscler., Thromb., Vasc. Biol. ATVBFA 17, 646–653 (1997). - PubMed
-
- Karino T. and Goldsmith H. L., “Role of blood cell-wall interactions in thrombogenesis and atherogenesis: A microrheological study,” Biorheology BRHLAU 21, 587–601 (1984). - PubMed
-
- Slager C. J., Wentzel J. J., Gijsen F. J., Thury A., van der Wal A. C., Schaar J. A., and Serruys P. W., “The role of shear stress in the destabilization of vulnerable plaques and related therapeutic implications,” Nat. Clin. Pract. Cardiovasc. Med. NCPCC4 2, 456–464 (2005).10.1038/ncpcardio0298 - DOI - PubMed
Publication types
MeSH terms
Substances
Grants and funding
LinkOut - more resources
Full Text Sources
Research Materials
Miscellaneous
