

Effect of finite sample size on feature selection and classification: a simulation study
- PMID: 20229900
- PMCID: PMC2826389
- DOI: 10.1118/1.3284974
Effect of finite sample size on feature selection and classification: a simulation study
Abstract
Purpose: The small number of samples available for training and testing is often the limiting factor in finding the most effective features and designing an optimal computer-aided diagnosis (CAD) system. Training on a limited set of samples introduces bias and variance in the performance of a CAD system relative to that trained with an infinite sample size. In this work, the authors conducted a simulation study to evaluate the performances of various combinations of classifiers and feature selection techniques and their dependence on the class distribution, dimensionality, and the training sample size. The understanding of these relationships will facilitate development of effective CAD systems under the constraint of limited available samples.
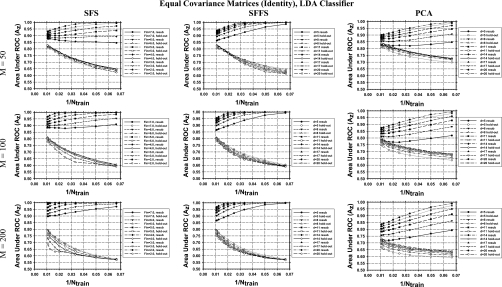
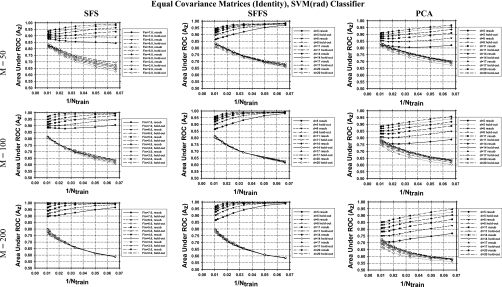
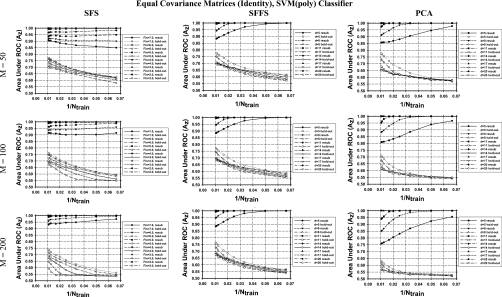
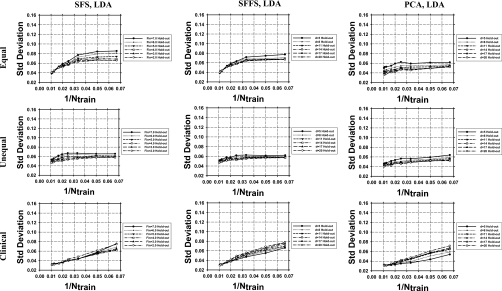
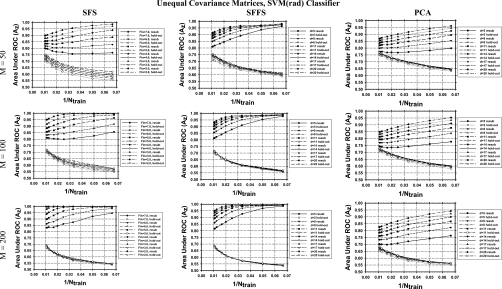
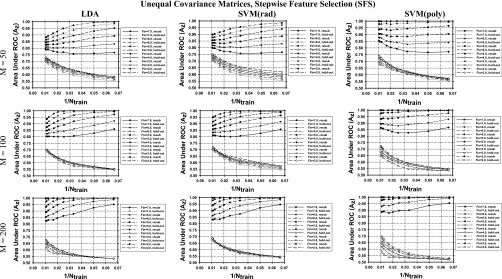
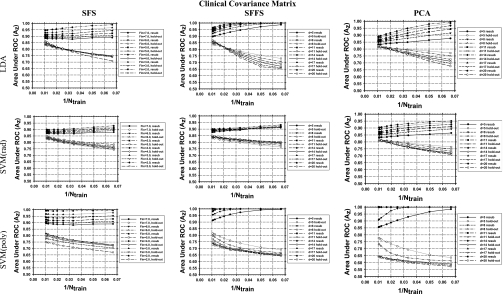
Methods: Three feature selection techniques, the stepwise feature selection (SFS), sequential floating forward search (SFFS), and principal component analysis (PCA), and two commonly used classifiers, Fisher's linear discriminant analysis (LDA) and support vector machine (SVM), were investigated. Samples were drawn from multidimensional feature spaces of multivariate Gaussian distributions with equal or unequal covariance matrices and unequal means, and with equal covariance matrices and unequal means estimated from a clinical data set. Classifier performance was quantified by the area under the receiver operating characteristic curve Az. The mean Az values obtained by resubstitution and hold-out methods were evaluated for training sample sizes ranging from 15 to 100 per class. The number of simulated features available for selection was chosen to be 50, 100, and 200.
Results: It was found that the relative performance of the different combinations of classifier and feature selection method depends on the feature space distributions, the dimensionality, and the available training sample sizes. The LDA and SVM with radial kernel performed similarly for most of the conditions evaluated in this study, although the SVM classifier showed a slightly higher hold-out performance than LDA for some conditions and vice versa for other conditions. PCA was comparable to or better than SFS and SFFS for LDA at small samples sizes, but inferior for SVM with polynomial kernel. For the class distributions simulated from clinical data, PCA did not show advantages over the other two feature selection methods. Under this condition, the SVM with radial kernel performed better than the LDA when few training samples were available, while LDA performed better when a large number of training samples were available.
Conclusions: None of the investigated feature selection-classifier combinations provided consistently superior performance under the studied conditions for different sample sizes and feature space distributions. In general, the SFFS method was comparable to the SFS method while PCA may have an advantage for Gaussian feature spaces with unequal covariance matrices. The performance of the SVM with radial kernel was better than, or comparable to, that of the SVM with polynomial kernel under most conditions studied.
Figures
Similar articles
-
Classifier design for computer-aided diagnosis: effects of finite sample size on the mean performance of classical and neural network classifiers.Med Phys. 1999 Dec;26(12):2654-68. doi: 10.1118/1.598805. Med Phys. 1999. PMID: 10619251
-
Feature selection and classifier performance in computer-aided diagnosis: the effect of finite sample size.Med Phys. 2000 Jul;27(7):1509-22. doi: 10.1118/1.599017. Med Phys. 2000. PMID: 10947254 Free PMC article.
-
Classifier performance prediction for computer-aided diagnosis using a limited dataset.Med Phys. 2008 Apr;35(4):1559-70. doi: 10.1118/1.2868757. Med Phys. 2008. PMID: 18491550 Free PMC article.
-
Classifier transfer with data selection strategies for online support vector machine classification with class imbalance.J Neural Eng. 2017 Apr;14(2):025003. doi: 10.1088/1741-2552/aa5166. Epub 2017 Feb 13. J Neural Eng. 2017. PMID: 28192282 Review.
-
Optimization of Network Topology in Computer-Aided Detection Schemes Using Phased Searching with NEAT in a Time-Scaled Framework.Cancer Inform. 2014 Oct 13;13(Suppl 1):17-27. doi: 10.4137/CIN.S13885. eCollection 2014. Cancer Inform. 2014. PMID: 25392680 Free PMC article. Review.
Cited by
-
Computer-aided detection system for clustered microcalcifications in digital breast tomosynthesis using joint information from volumetric and planar projection images.Phys Med Biol. 2015 Nov 7;60(21):8457-79. doi: 10.1088/0031-9155/60/21/8457. Epub 2015 Oct 14. Phys Med Biol. 2015. PMID: 26464355 Free PMC article.
-
Mass detection in digital breast tomosynthesis: Deep convolutional neural network with transfer learning from mammography.Med Phys. 2016 Dec;43(12):6654. doi: 10.1118/1.4967345. Med Phys. 2016. PMID: 27908154 Free PMC article.
-
Personalized prediction model for seizure-free epilepsy with levetiracetam therapy: a retrospective data analysis using support vector machine.Br J Clin Pharmacol. 2018 Nov;84(11):2615-2624. doi: 10.1111/bcp.13720. Epub 2018 Sep 3. Br J Clin Pharmacol. 2018. PMID: 30043454 Free PMC article.
-
Machine Learning for Medical Imaging.Radiographics. 2017 Mar-Apr;37(2):505-515. doi: 10.1148/rg.2017160130. Epub 2017 Feb 17. Radiographics. 2017. PMID: 28212054 Free PMC article. Review.
-
Integrating Rapid Evaporative Ionization Mass Spectrometry Classification with Matrix-Assisted Laser Desorption Ionization Mass Spectrometry Imaging and Liquid Chromatography-Tandem Mass Spectrometry to Unveil Glioblastoma Overall Survival Prediction.ACS Chem Neurosci. 2025 Mar 19;16(6):1021-1033. doi: 10.1021/acschemneuro.4c00463. Epub 2025 Feb 25. ACS Chem Neurosci. 2025. PMID: 40007067 Free PMC article.
References
Publication types
MeSH terms
Grants and funding
LinkOut - more resources
Full Text Sources
Other Literature Sources
Miscellaneous
