

Effect of anabolic-androgenic steroids and glucocorticoids on the kinetics of hAR and hGR nucleocytoplasmic translocation
- PMID: 20230007
- PMCID: PMC2882525
- DOI: 10.1021/mp900259w
Effect of anabolic-androgenic steroids and glucocorticoids on the kinetics of hAR and hGR nucleocytoplasmic translocation
Abstract
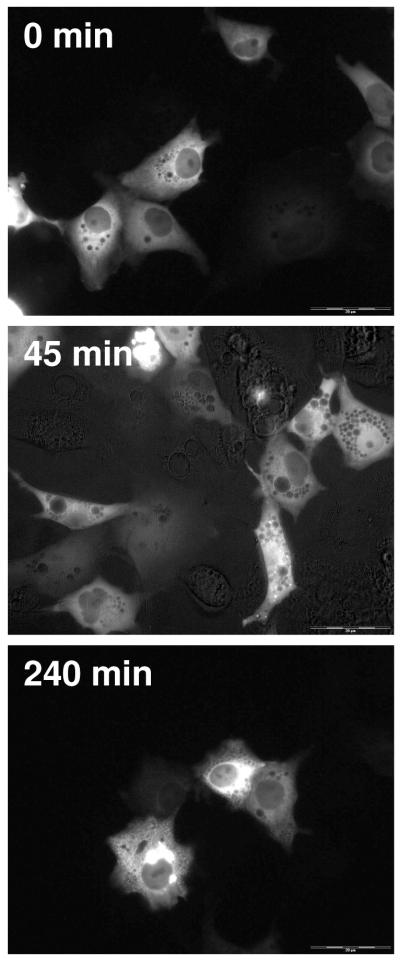
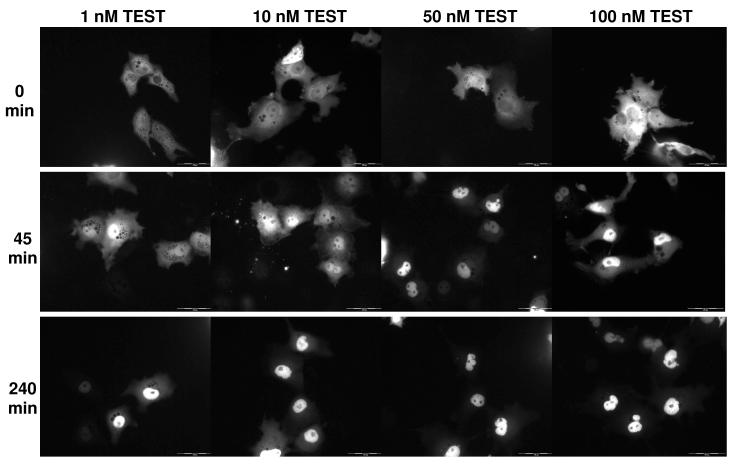
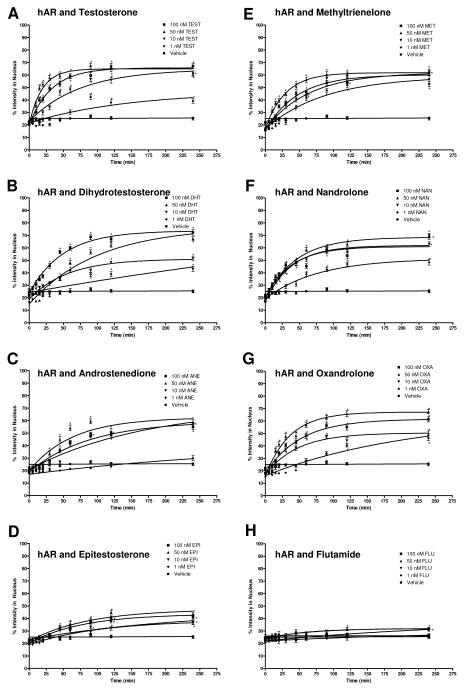
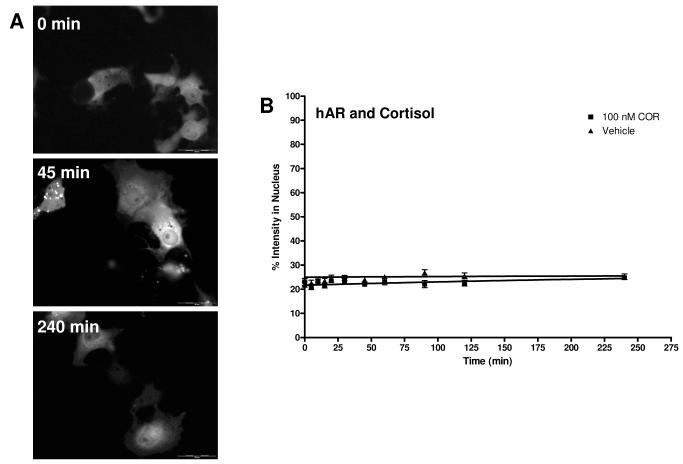
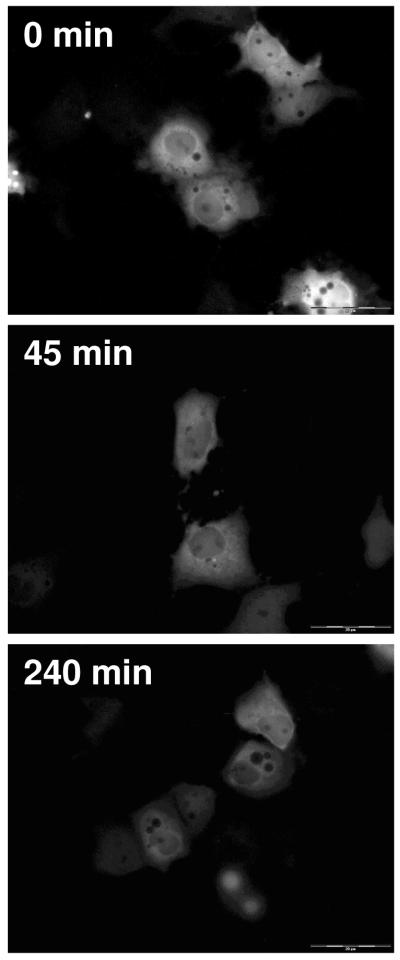
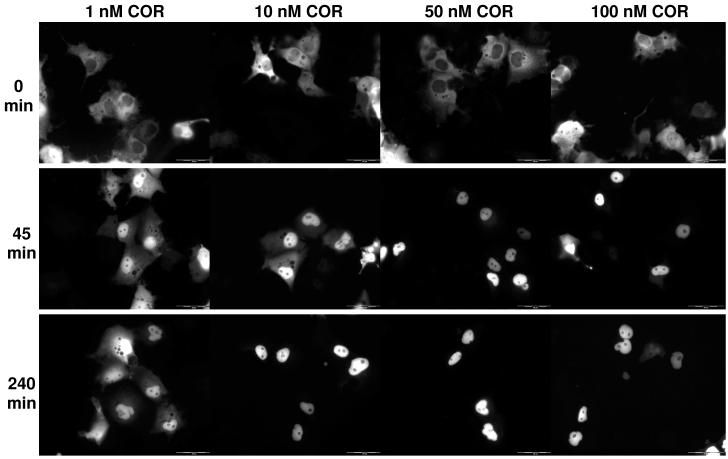
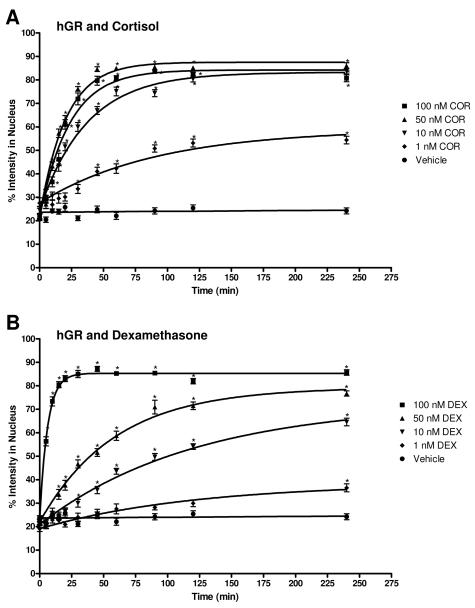
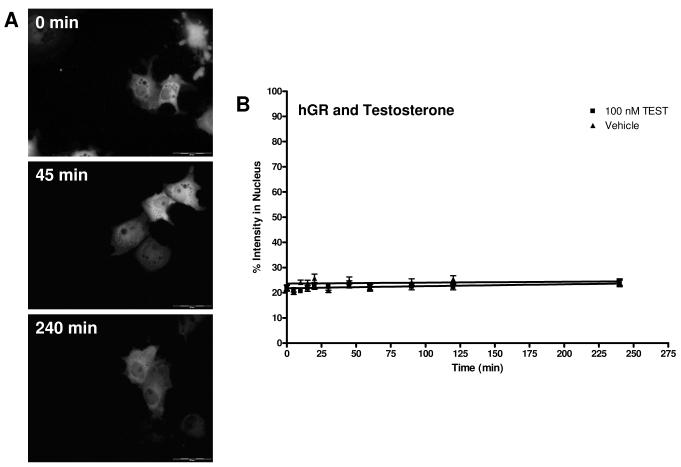
Although the qualitative nucleocytoplasmic transport of nuclear hormone receptors (NHRs) has been studied, there is little documentation of the cellular kinetics of this transport. Here, translocation studies using the human androgen receptor (hAR) and the human glucocorticoid receptor (hGR) were performed to aid in identifying the mechanism by which anabolic-androgenic steroids (AAS) were activating hAR and potentially interacting with hGR and how glucocorticoid ligands were interacting with the hGR and hAR. The real-time analysis of EGFP-labeled hAR and hGR ligand-induced cytoplasm-to-nucleus translocation was performed using fluorescence microscopy to better understand the action of these NHRs in a physiologically relevant cell-based model. After transient transfection, the hAR and hGR individually translocate as expected (i.e., transport is ligand-induced and dose-dependent) in this model biological system. Testosterone (TEST) had the fastest translocation rate for the hAR of 0.0525 min(-1). The other endogenous steroids, androstenedione (ANE) and dihydrotestosterone (DHT), had considerably lower hAR transport rates. The rates of hAR transport for the exogenous steroids methyltrienelone (MET), nandrolone (NAN), and oxandrolone (OXA) are lower than that of testosterone and similar to those of the endogenous steroids ANE and DHT. The hGR transport rates for cortisol (COR) and dexamethasone (DEX) are also presented. The synthetic GC, DEX, had a more rapid translocation rate (0.1599 min(-1)) at the highest dose of 100 nM compared to the endogenous GC COR (0.0431 min(-1)). The data obtained agrees with the existing qualitative data and adds an important ligand-dependent kinetic component to hAR and hGR transport. These kinetic data can aid our understanding of NHR action and interaction with other regulatory proteins, and can be useful in the development of new therapies.
Figures
Similar articles
-
Adrenal Steroid Metabolites Accumulating in Congenital Adrenal Hyperplasia Lead to Transactivation of the Glucocorticoid Receptor.Endocrinology. 2015 Oct;156(10):3504-10. doi: 10.1210/en.2015-1087. Epub 2015 Jul 24. Endocrinology. 2015. PMID: 26207344
-
Immunocytochemical analysis of hormone mediated nuclear translocation of wild type and mutant glucocorticoid receptors.J Steroid Biochem Mol Biol. 1995 Nov;55(2):135-46. doi: 10.1016/0960-0760(95)00174-x. J Steroid Biochem Mol Biol. 1995. PMID: 7495692
-
Mechanism of action of bolandiol (19-nortestosterone-3beta,17beta-diol), a unique anabolic steroid with androgenic, estrogenic, and progestational activities.J Steroid Biochem Mol Biol. 2010 Feb 15;118(3):151-61. doi: 10.1016/j.jsbmb.2009.11.008. Epub 2009 Nov 24. J Steroid Biochem Mol Biol. 2010. PMID: 19941958 Free PMC article.
-
[Myoanabolic steroids and selective androgen receptor modulators: mechanism of action and perspectives].Orv Hetil. 2009 Nov 8;150(45):2051-9. doi: 10.1556/OH.2009.28739. Orv Hetil. 2009. PMID: 19861292 Review. Hungarian.
-
Effects of androgenic-anabolic steroids in athletes.Sports Med. 2004;34(8):513-54. doi: 10.2165/00007256-200434080-00003. Sports Med. 2004. PMID: 15248788 Review.
Cited by
-
The androgen receptor and its use in biological assays: looking toward effect-based testing and its applications.J Anal Toxicol. 2011 Nov;35(9):594-607. doi: 10.1093/anatox/35.9.594. J Anal Toxicol. 2011. PMID: 22080898 Free PMC article. Review.
-
Role of androgens in dhea-induced rack1 expression and cytokine modulation in monocytes.Immun Ageing. 2016 May 29;13:20. doi: 10.1186/s12979-016-0075-y. eCollection 2016. Immun Ageing. 2016. PMID: 27239218 Free PMC article.
References
-
- Agler M, Prack M, Zhu Y, Kolb J, Nowak K, Ryseck R, Shen D, Cvijic ME, Somerville J, Nadler S, Chen T. J Biomol Screen. 2007;12(8):1029–41. - PubMed
-
- Cogan PS, Koch TH. J Med Chem. 2004;47(23):5690–9. - PubMed
-
- Georget V, Lobaccaro JM, Terouanne B, Mangeat P, Nicolas JC, Sultan C. Mol Cell Endocrinol. 1997;129(1):17–26. - PubMed
-
- Kawata M. Arch Histol Cytol. 2001;64(4):353–68. - PubMed
Publication types
MeSH terms
Substances
Grants and funding
LinkOut - more resources
Full Text Sources
Medical
Miscellaneous
